@aliasliyu4
2018-10-12T05:34:07.000000Z
字数 2547
阅读 35696
prometheus监控系统在"一下"的应用
最近入职一下,发现这边的监控系统使用的是prometheus+ grafana, 由于之前用过statsd+grafana,所以有必要对这一套监控做一些探究,以达到掌握运用的地步。
是什么
- metric收集并且存储
- querying language, 报警,控制台展示
起源
- 2012年诞生于SoundCloud
- 2015年对外发布
- 目前属于CNCF基金会
架构图

node_exporter – 用于机器系统数据收集
mysqld_exporter – 用于MySQL服务器数据收集
prometheus主动拉取app监控数据
client也可主动推送metrics到PushGateway,而Prometheus只是定时去Gateway上抓取数据,则需要PushGateway组件
也可以通过服务发现灵活的配置metadata
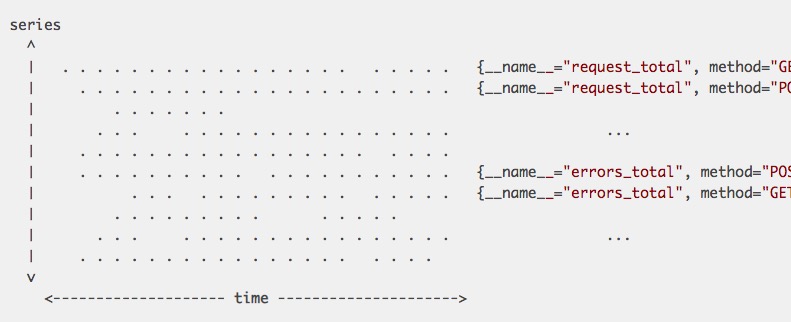
数据模型
时间序列模型
<identifier> [(t0, v0), (t1, v1)]t表示时间:int64v表示值: float64identifier example:http_requests+total{job="nginx",instance="10.10.10.1",path:="/aliasliyu4",status="200"}http_requests+total{job="nginx",instance="10.10.10.1",path:="/zhuying",status="500"}http_requests+total{job="nginx",instance="10.10.10.1",path:="/zhuying",status="400"}http_requests+total{job="nginx",instance="10.10.10.1",path:="/aliasliyu4",status="200"}
querying
定义一种语言:PrmoQL
* 新的查询语言
* 时间序列计算
* 并不是sql风格的而是函数式
查询root超过了100 GB的mount。node_filesystem_bytes_total{mountpoint!="/"} / le9 > 100{device="sda1", mountpoint="/home", instance="10.10.10.1"} 118.8{device="sda1", mountpoint="/home", instance="10.10.10.4"} 118.8{device="sda1", mountpoint="/data", instance="10.10.10.3"} 1218.8{device="sfaf", mountpoint="/opt", instance="10.10.10.2"} 218.8如上metric命名规范:名称开头_监测对像_数值类型_单位node_filesystem_bytes_total
查询请求错误的比例sum(rate(http_request_total{status="500"}[5m]))/ sum(rate(http_request_total[5m]))output: {} 0.029
alerting
ALERT Many500ErrorsIF(sum by(path) (rate(http_requests_total{status="500"}[5m]))/sum by(path) (rate(http_requests_total{status="500"}[5m])))*100 >5FOR 5mLABELS {severity = "critical"}ANNOTATIONS{summary = "Many 500 errors for path {{$labels.path}} ({{$value}}%)"}
统计类型
Counter
Counter 用于累计值,例如 记录 请求次数、任务完成数、错误发生次数。
一直增加,不会减少。
重启进程后,会被重置。
例如:http_response_total{method=”GET”,endpoint=”/api/tracks”} 100
10秒后抓取 http_response_total{method=”GET”,endpoint=”/api/tracks”} 100
Gauge
Gauge 常规数值,例如 温度变化、内存使用变化。
可变大,可变小。
重启进程后,会被重置
例如: memory_usage_bytes{host=”master-01″} 100 < 抓取值
memory_usage_bytes{host=”master-01″} 30
memory_usage_bytes{host=”master-01″} 50
memory_usage_bytes{host=”master-01″} 80 < 抓取值
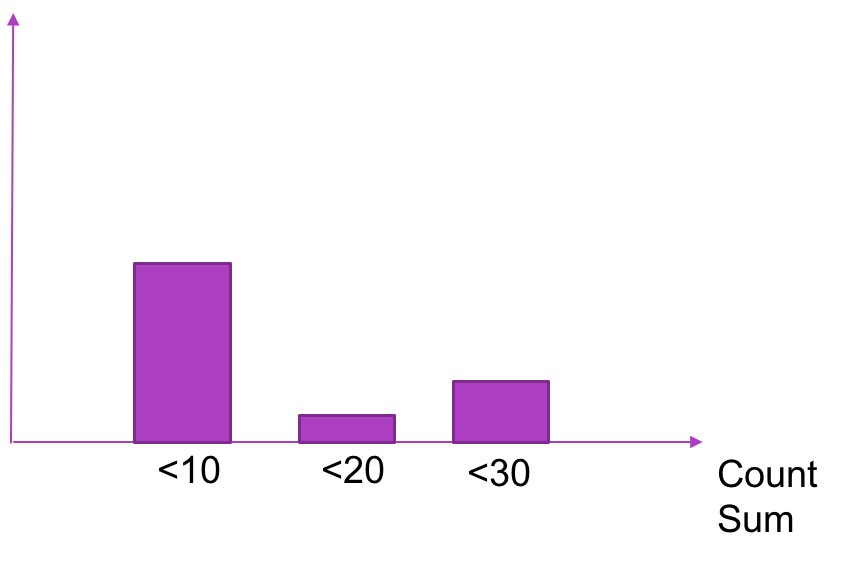
Histogram
Histogram 可以理解为柱状图的意思,常用于跟踪事件发生的规模,例如:请求耗时、响应大小。它特别之处是可以对记录的内容进行分组,提供 count 和 sum 全部值的功能。
例如:{小于10=5次,小于20=1次,小于30=2次},count=7次,sum=7次的求和值
Summary
Summary和Histogram十分相似,常用于跟踪事件发生的规模,例如:请求耗时、响应大小。同样提供 count 和 sum 全部值的功能。
例如:count=7次,sum=7次的值求值
它提供一个quantiles的功能,可以按%比划分跟踪的结果。例如:quantile取值0.95,表示取采样值里面的95%数据。
参考:
https://github.com/1046102779/prometheus/blob/master/prometheus/querying/functions.md
https://www.youtube.com/watch?v=PDxcEzu62jk&t=761s
https://prometheus.io/docs/practices/histograms/
https://fabxc.org/tsdb/
http://ylzheng.com/2017/07/07/prometheus-exporter-example-go/
