@Yori
2015-01-14T14:11:15.000000Z
字数 4050
阅读 1424
The Other Side of Go
Go
注:此文为[The other side of Go: Programming Pictures, the Read, Parse, Draw Pattern]翻译
在项目中,Go往往被认为适合用来做后端开发,而有时我们也会遇到图形上的需求,在处理图形效果时Go的表现同样十分出色。这篇文章将会介绍如何通过SVGo来将数据生成图像(特别是矢量图像)。
在SVGo的API中,提供了一个功能:生成标准 SVG 到一个 io.Writer。这样一来,得益于Go中I/O包的灵活性,我们可以在任何需要输出的地方输出图片,如标准输出、文件、网络链接或者Web Server 中。
SVGo的设计思想使我们在对高层对象(即圆、矩形、线、 多边形、曲线等)进行操作时,可以想到利用程序的逻辑性来管理其布局和元素之间的关系,并且根据需要向该高层对象应用图形样式和其他属性。
读取/解析/绘制 模式
一个根据自己或者网络资源生成图像的方式就是读取/解析/绘制模式。这个模式一般包括以下几个步骤:
- 定义输入数据的结构和地址
- 读取输入的数据
- 解析并加载数据结构
- 通过结构绘制图像
下面通过一个简单的例子,解释如何通过从XML(使用JSON也非常相似)中获取数据并且生成一个简单的可视化的SVG。需要注意的是,如果采用自定义数据,你可以自由的定义数据的结构,但如果使用其他诸如Internet service APIs的数据来源时,需要遵循它们定义好的数据结构。
下面是本例中用到的XML 输入(thing.xml)
<thing top="100" left="100" sep="100"><item width="50" height="50" name="Little" color="blue">This is small</item><item width="75" height="100" name="Med" color="green">This is medium</item><item width="100" height="200" name="Big" color="red">This is large</item></thing>
首先,定义和输入匹配的数据结构。在例子中,我们可以看到在结构体中定义的元素和数据属性之间的对应关系:结构体'Thing'中定义了图形初始时的顶部和左侧的位置和元素的间距。'Thing'中包含了多个'item',每个'item'都有高度、宽度、名称、颜色和文本。
type Thing struct {Top int `xml:"top,attr"`Left int `xml:"left,attr"`Sep int `xml:"sep,attr"`Item []item `xml:"item"`}type item struct {Width int `xml:"width,attr"`Height int `xml:"height,attr"`Name string `xml:"name,attr"`Color string `xml:"color,attr"`Text string `xml:",chardata"`}
声明了新的svg对象并指明画布尺寸
var (canvas = svg.New(os.Stdout)width = flag.Int("w", 1024, "width")height = flag.Int("h", 768, "height"))
接下来,实现一个方法用读入数据
func dothing(location string) {f, err := os.Open(location)if err != nil {fmt.Fprintf(os.Stderr, "%v\n", err)return}defer f.Close()readthing(f)}
接下来实现的是一个重要的功能,即解析数据并加载定义的图形结构。这里解析直接使用了Go的标准库的XML包:通过io.Reader传递到NewDecoder,并Decode一个'Thing'实例。
func readthing(r io.Reader) {var t Thingif err := xml.NewDecoder(r).Decode(&t); err != nil {fmt.Fprintf(os.Stderr, "Unable to parse components (%v)\n", err)return}drawthing(t)}
最后, 在加载并解析了数据之后,使用SVGo库使图像可视化.在这个例子中,item表现为圆圈,每个item都设置了初始坐标,并且都有各自的尺寸和颜色,然后为每个item添加描述文本,最后给item之间设置垂直间距。
func drawthing(t Thing) {x := t.Lefty := t.Topfor _, v := range t.Item {style := fmt.Sprintf("font-size:%dpx;fill:%s", v.Width/2, v.Color)canvas.Circle(x, y, v.Height/4, "fill:"+v.Color)canvas.Text(x+t.Sep, y, v.Name+":"+v.Text+"/"+v.Color, style)y += v.Height}}
在主函数中初始化画布并调用方法dothing()读入数据
func main() {flag.Parse()for _, f := range flag.Args() {canvas.Start(*width, *height)dothing(f)canvas.End()}}
运行这个程序,在命令行中读入数据文件(thing.xml)
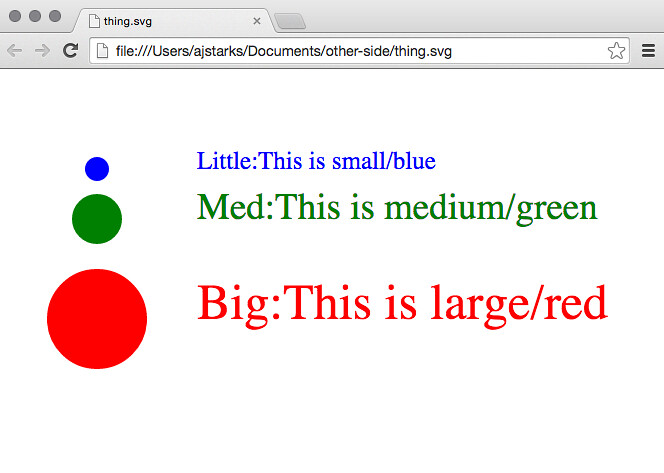
$ go run rpd.go thing.xml<?xml version="1.0"?><!-- Generated by SVGo --><svg width="1024" height="768"xmlns="http://www.w3.org/2000/svg"xmlns:xlink="http://www.w3.org/1999/xlink"><circle cx="100" cy="100" r="12" style="fill:blue"/><text x="200" y="100" style="font-size:25px;fill:blue">Little:This is small/blue</text><circle cx="100" cy="150" r="25" style="fill:green"/><text x="200" y="150" style="font-size:37px;fill:green">Med:This is medium/green</text><circle cx="100" cy="250" r="50" style="fill:red"/><text x="200" y="250" style="font-size:50px;fill:red">Big:This is large/red</text></svg>
在浏览器中查看,这个例子的结果看起来像这样:
通过这种模式,我们可以构建很多可视化工具.比如在工作我有工具来构建传统的诸如 柱形图表 和 bulletgraphs 之类的图表,同时也用来替代饼图 , 路线图, 组件 图 , 时间、热图和计分网格。
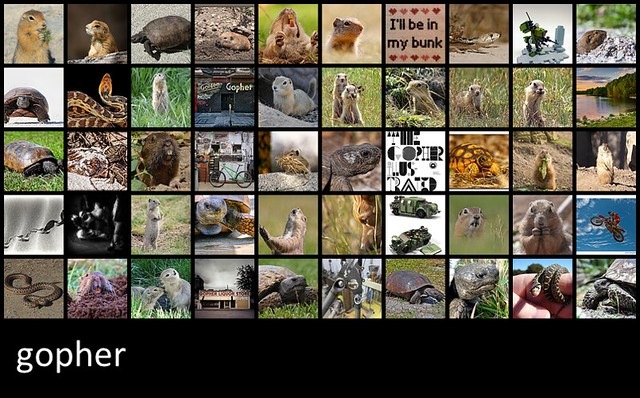
同样你也可以用 Internet APIs提供的数据生成SVG.举个例子, 'f50' 程序需要一个关键字和显示通过Flicker的"interestingness"算法筛选的图片的网格。'f50' 采用了和上面例子一样的模式,但是通过发送HTTPS请求,解析XML响应来获取数据生成图片
$ f50 sunset
响应内容:
<?xml version="1.0" encoding="utf-8" ?><rsp stat="ok"><photo id="15871035007" ... secret="84d59df678" server="7546" farm="8" title="flickr-gopher" ... /><photo id="15433662714" ... secret="3b9358c61d" server="7559" farm="8" title="Laurence Maroney 2006..." ... />...</rsp>
'f50'选取id、secret、farm、server和title属性来构建这张图片,如下所示:
// makeURI converts the elements of a photo into a Flickr photo URIfunc makeURI(p Photo, imsize string) string {im := p.Id + "_" + p.Secretif len(imsize) > 0 {im += "_" + imsize}return fmt.Sprintf(urifmt, p.Farm, p.Server, im)}// imageGrid reads the response from Flickr, and creates a grid of imagesfunc imageGrid(f FlickrResp, x, y, cols, gutter int, imgsize string) {if f.Stat != "ok" {fmt.Fprintf(os.Stderr, "Status: %v\n", f.Stat)return}xpos := xfor i, p := range f.Photos.Photo {if i%cols == 0 && i > 0 {xpos = xy += (imageHeight + gutter)}canvas.Link(makeURI(p, ""), p.Title)canvas.Image(xpos, y, imageWidth, imageHeight, makeURI(p, "s"))canvas.LinkEnd()xpos += (imageWidth + gutter)}}
如果你在浏览器中查看结果,将鼠标悬停在一张图片上,你会看到这张图片的标题,并且点击可以看到大图