@leona1992
2022-08-03T15:38:10.000000Z
字数 2105
阅读 278
梯度下降法2
python 机器学习 梯度下降法
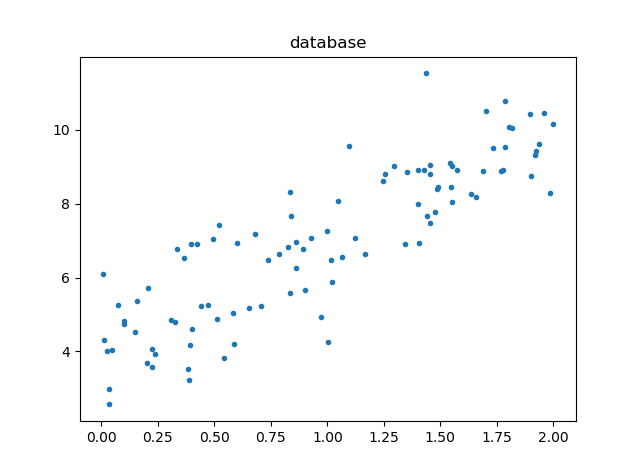
生成数据集
import numpy as npimport matplotlib.pyplot as pltnp.random.seed(666)x = 2 * np.random.random(size=100)y = x * 3. + 4. + np.random.normal(size=100)X = x.reshape(-1, 1)plt.scatter(x,y,marker='.')plt.title('database')plt.show()
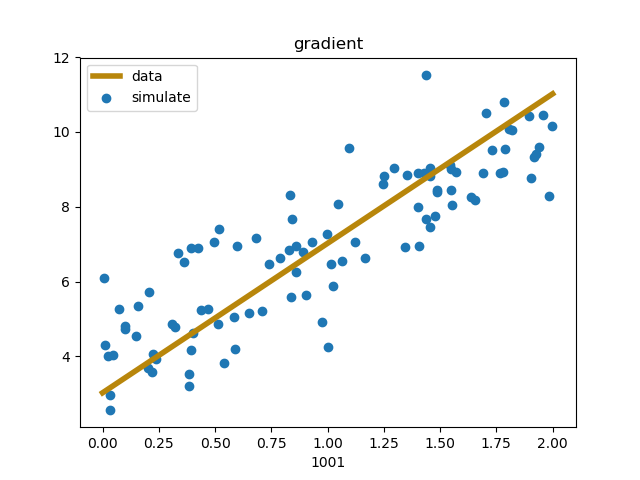
梯度下降法进行训练
目标:使得尽可能小
生成:
def J(theta, X_b, y):try:return np.sum((y - X_b.dot(theta))**2) / len(X_b)except:return float('inf')
def dJ(theta, X_b, y):res = np.empty(len(theta))res[0] = np.sum(X_b.dot(theta) - y)for i in range(1, len(theta)):res[i] = (X_b.dot(theta) - y).dot(X_b[:, i])return res * 2 / len(X_b)
def gradient_descent(X_b, y, initial_theta, eta, n_iters=1e4, epsilon=1e-8):theta = initial_thetai_iter = 0xb = (np.array(X_b)[:, 1])while i_iter < n_iters:plt.ion()gradient = dJ(theta, X_b, y)last_theta = thetatheta = theta - eta * gradient#while (i_iter % 1000) == 1:while (i_iter < 150) & ((i_iter % 5) == 1):print(i_iter)xq = [0, 2]yq = theta[0] * np.array(xq) + theta[1] * np.ones(np.shape(theta))fig = plt.figure()fig = plt.scatter((np.array(X_b)[:, 1]), y)fig = plt.plot(xq, yq, linewidth=4, color='darkgoldenrod')fig = plt.legend(['data', 'simulate'], loc='upper left')fig = plt.title('gradient')fig = plt.xlabel(i_iter)plt.savefig(r"C:\\Users\\xiaoy\\Pictures\\s\\" + format(i_iter+100) +'.png')plt.show()print(theta)plt.close()i_iter = i_iter + 1if (abs(J(theta, X_b, y) - J(last_theta, X_b, y)) < epsilon):breaki_iter = i_iter + 1return thetatheta = gradient_descent(X_b, y, initial_theta, eta)print("荣耀不朽")
1000多次迭代结束