@leona1992
2024-04-30T05:32:52.000000Z
字数 784
阅读 145
在此处输入标题[TOC]
data_io1.py
SAC-data
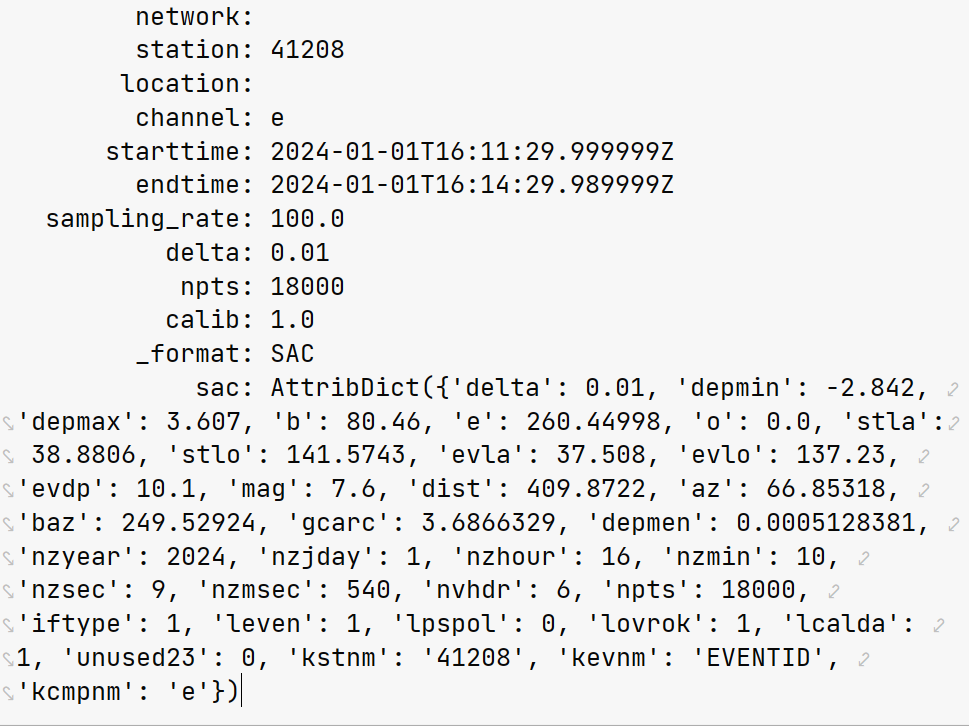

read the data-->noto.bat
data_all.m
Theoretical P-wave arrival time, S-wave arrival time
Basic information
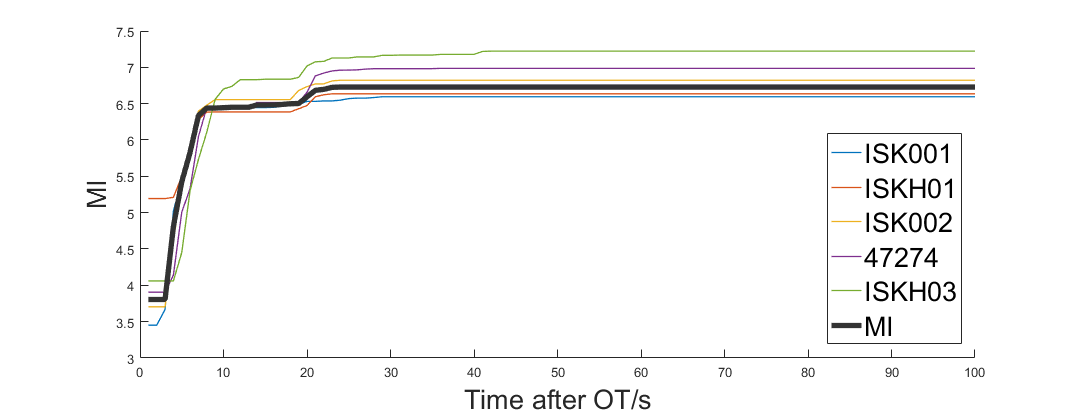
MI_calculation
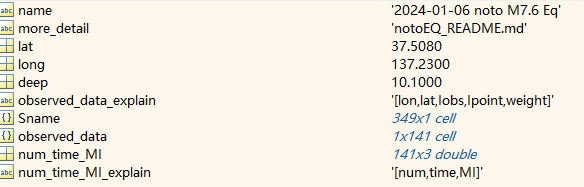
noto_obs.m
observed information --> noto_struct.mat
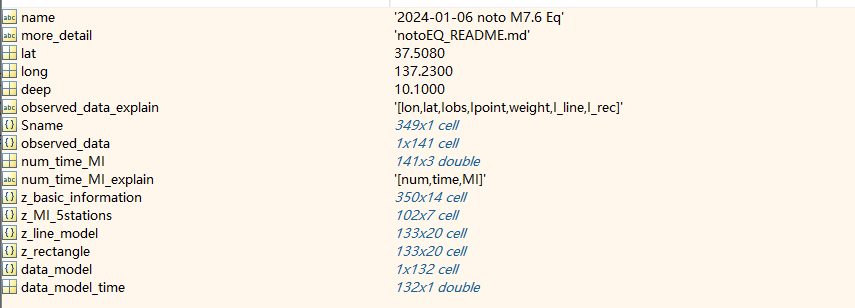
noto_est.m
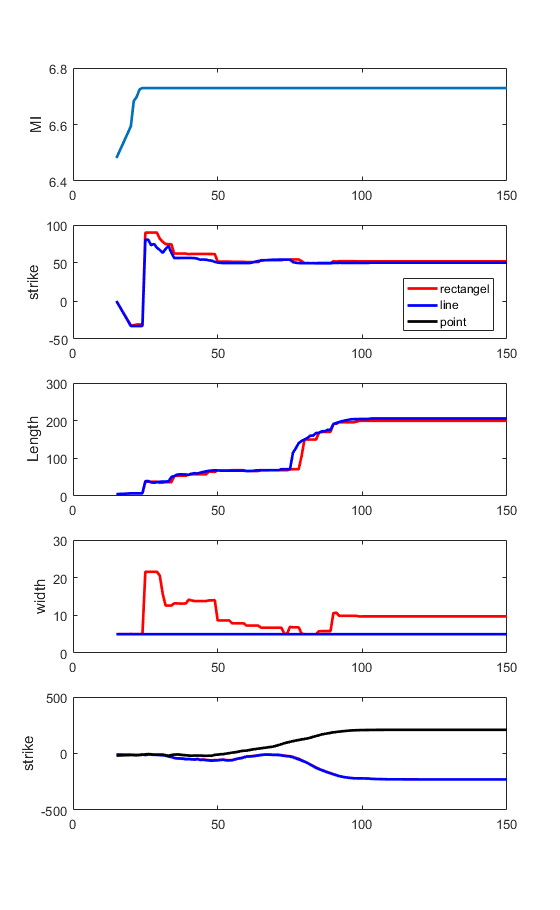
Optimal model calculation -->result{'time','L','W','xita','rl'}
noto_plot1.m
noto.xlsx

noto_plot2.m
All the details about the earthquake model-->noto_final.mat
noto_plot3.m
save all figures at
noto_plot4.m
Functions
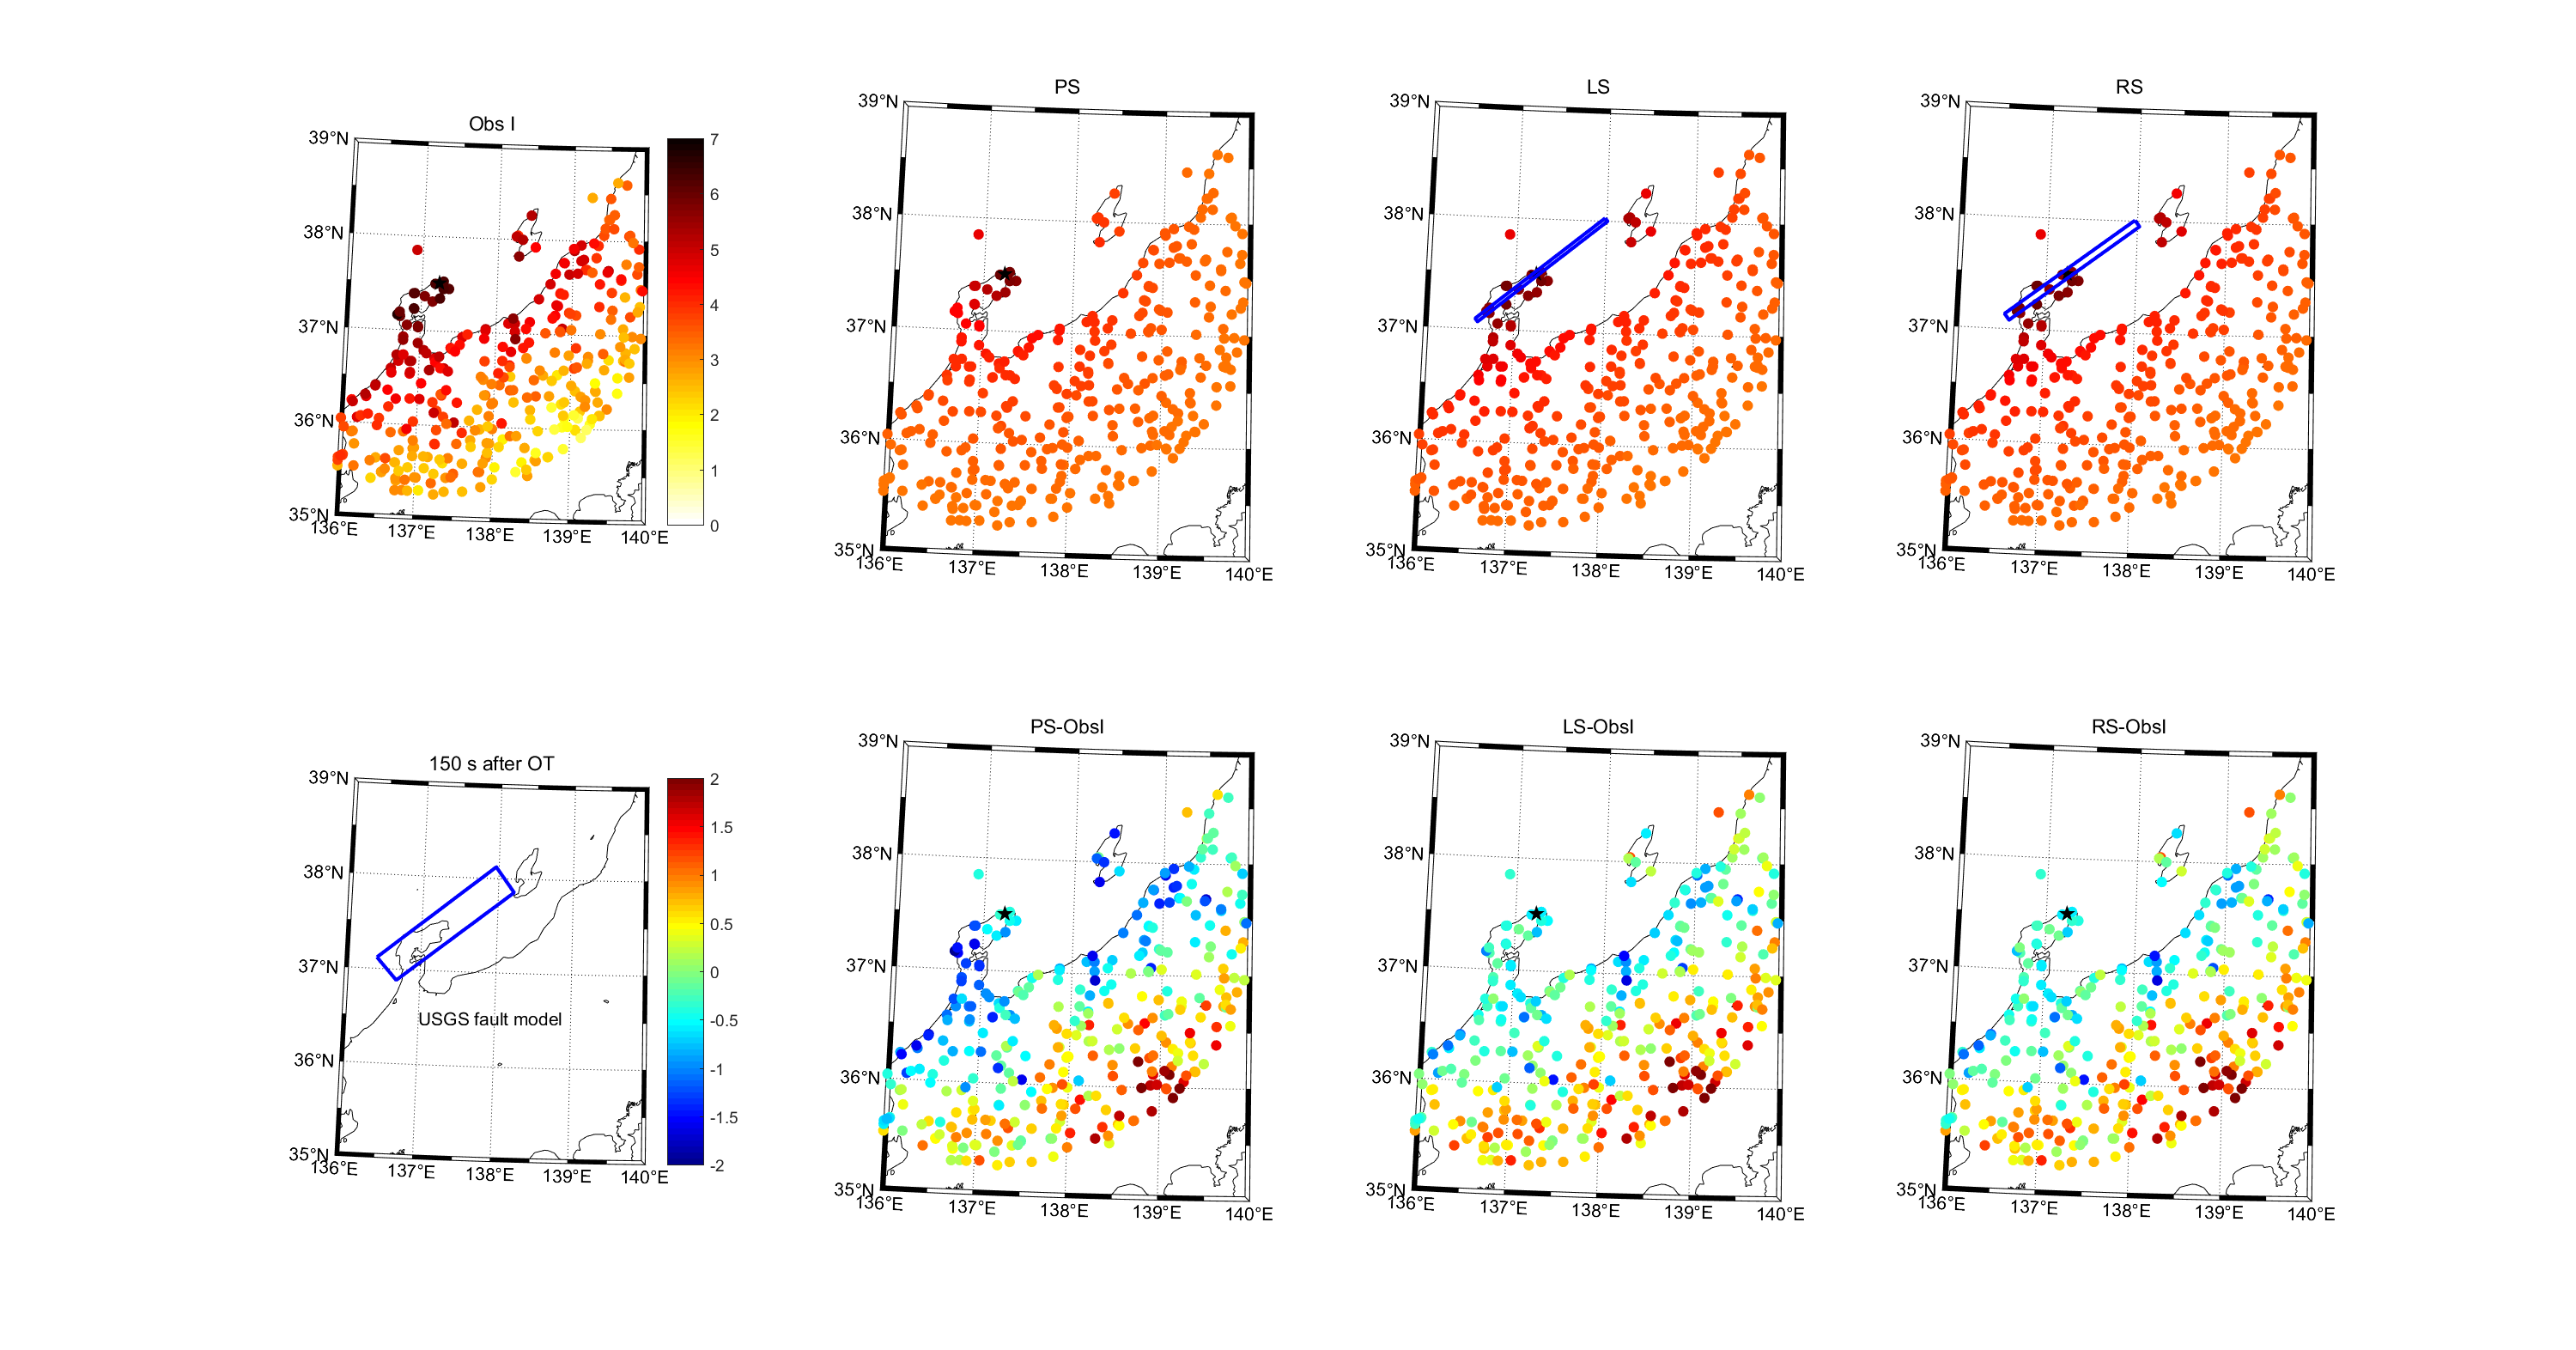
I_noto --> **observed intensity **
filter1.m/filter2.m/initialize1.m/initialize2.m/finish1.m --> filter
filter(Kunugi et al., 2013):https://static.zybuluo.com/leona1992/m77wzpx6bjr5cksroa1po61h/kunugi2013.pdf
getTraveltime --> travel time tp/ts
fdist_fast.m --> min distance from stations to the fault model(if station inside rectangle, set dis=5km)
fminsearchbnd.m/fminsearchcon.m -->quick search algorithm
未分类
在此输入正文
