@c-xy
2016-12-04T15:06:43.000000Z
字数 9208
阅读 140
第十一次作业
Exercis 11
一、背景
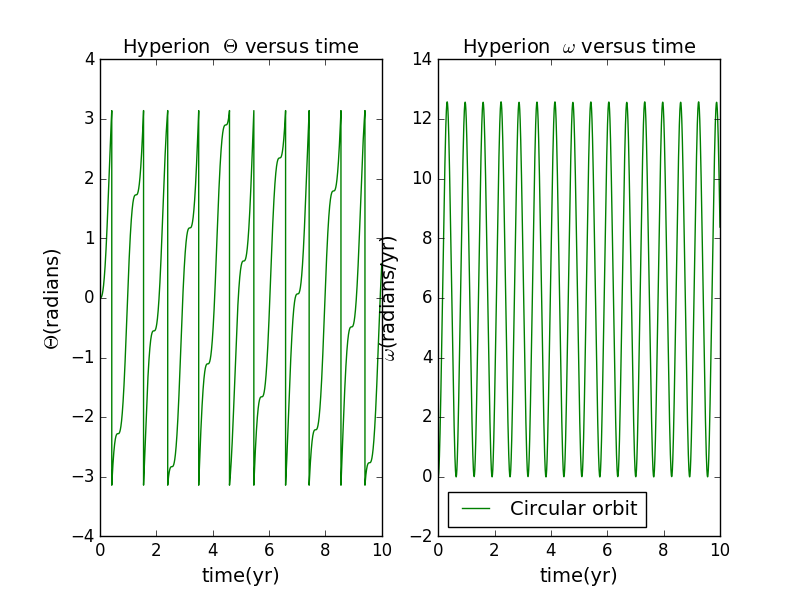
As we have known,Hyperion has an unusual shape,leading to its different behavior.Hyperion is shaped more like an egg and its orbit is choatic. We letbe the angle that the rod makes with the x axis and define the associated angular velocity.The center of the mass of the object isand.
After some algebra,we can obtain:
We can obtainby using
二。代码
1.
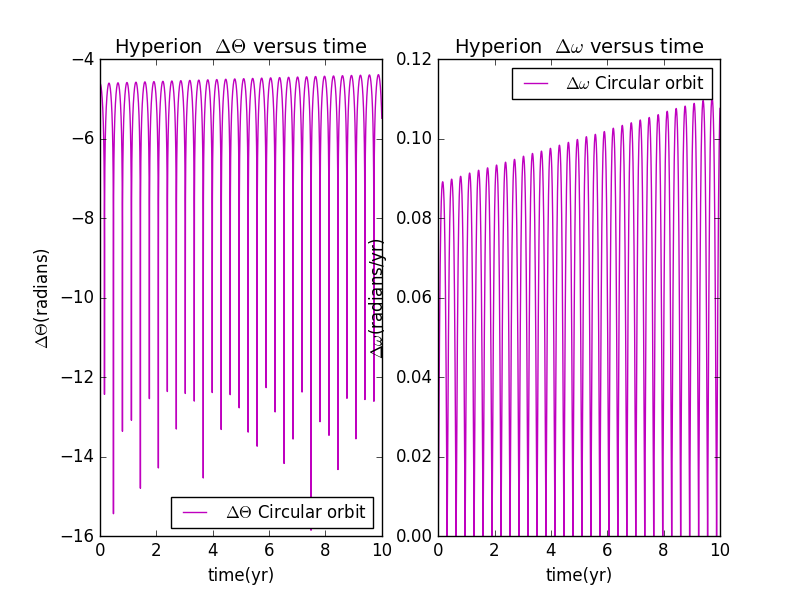
import matplotlib.pyplot as pltimport numpy as npimport mathclass hyperion:def __init__(self,GM=4*math.pi**2,dt=0.0001,time=10):self.GM=GMself.x=[1]self.y=[0]self.vx=[0]self.vy=[2*math.pi]self.dt=dtself.time=timeself.r=[math.sqrt(self.x[0]**2+self.y[0]**2)]self.t=[0]self.w=[0]self.theta=[0]def calculate(self):for i in range(int(self.time//self.dt)):self.vx.append(self.vx[i]-self.GM*self.x[i]*self.dt/self.r[i]**3)self.vy.append(self.vy[i]-self.GM*self.y[i]*self.dt/self.r[i]**3)self.x.append(self.x[i]+self.vx[i+1]*self.dt)self.y.append(self.y[i]+self.vy[i+1]*self.dt)self.r.append(math.sqrt(self.x[i+1]**2+self.y[i+1]**2))self.w.append(self.w[i]-3*self.GM/self.r[i]**5*(self.x[i]*math.sin(self.theta[i])-self.y[i]*math.cos(self.theta[i]))*(self.x[i]*math.cos(self.theta[i])+self.y[i]*math.sin(self.theta[i]))*self.dt)self.theta.append(self.theta[i]+self.w[i+1]*self.dt)self.t.append(self.t[i]+self.dt)if self.theta[i+1]<-math.pi:self.theta[i+1]=self.theta[i+1]+2*math.piif self.theta[i+1]>math.pi:self.theta[i+1]=self.theta[i+1]-2*math.pidef show_results(self,color):ax1=plt.subplot(121)ax2=plt.subplot(122)plt.sca(ax1)plt.plot(self.t,self.theta,'g',label=r'Circular orbit')plt.title(r'Hyperion $\Theta$ versus time',fontsize=14)plt.xlabel(u'time(yr)',fontsize=14)plt.ylabel(u'$\Theta$(radians)',fontsize=14)plt.sca(ax2)plt.plot(self.t,self.w,'g',label=r'Circular orbit')plt.title(r'Hyperion $\omega$ versus time',fontsize=14)plt.xlabel(u'time(yr)',fontsize=14)plt.ylabel(u'$\omega$(radians/yr)',fontsize=14)#plt.xlim(-1,1)#plt.ylim(-1,1)plt.legend(fontsize=14,loc='best')a=hyperion()a.calculate()a.show_results('g')plt.show()
2.
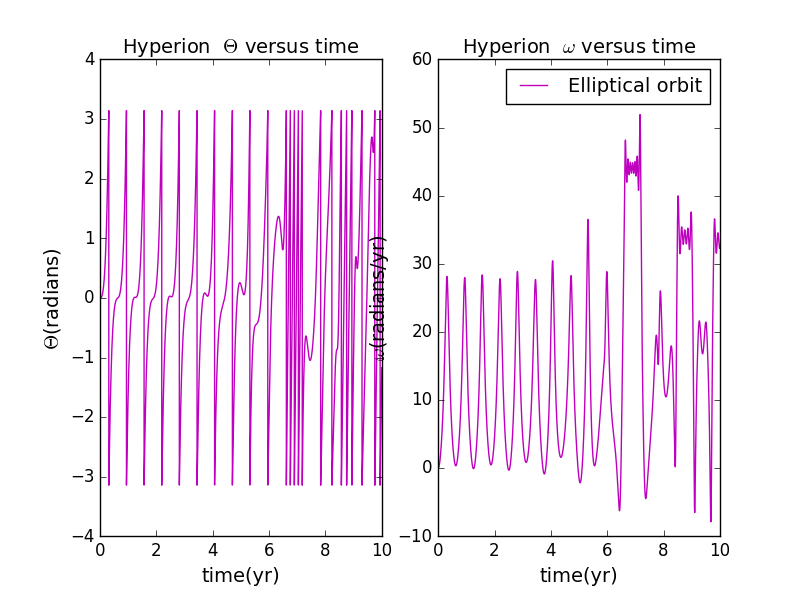
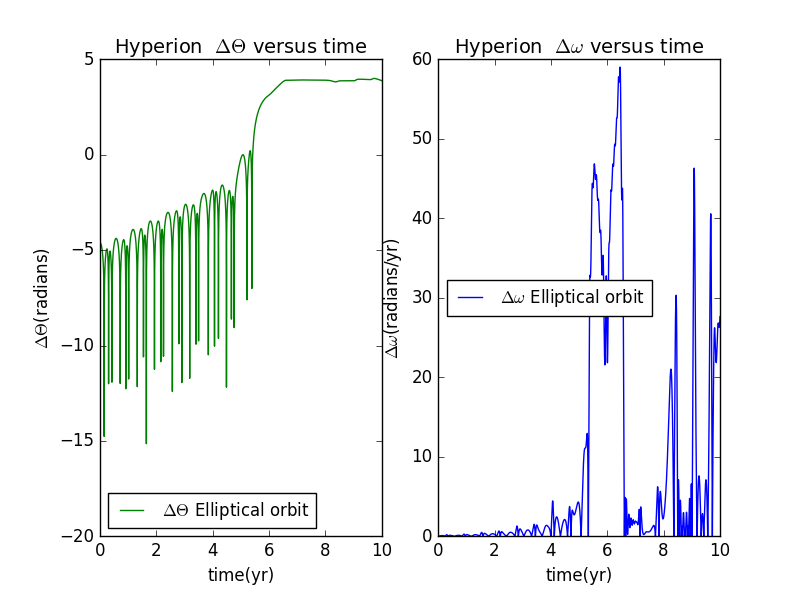
import matplotlib.pyplot as pltimport numpy as npimport mathclass hyperion:def __init__(self,GM=4*math.pi**2,dt=0.0001,time=10):self.GM=GMself.x=[1]self.y=[0]self.vx=[0]self.vy=[5]self.dt=dtself.time=timeself.r=[math.sqrt(self.x[0]**2+self.y[0]**2)]self.t=[0]self.w=[0]self.theta=[0]def calculate(self):for i in range(int(self.time//self.dt)):self.vx.append(self.vx[i]-self.GM*self.x[i]*self.dt/self.r[i]**3)self.vy.append(self.vy[i]-self.GM*self.y[i]*self.dt/self.r[i]**3)self.x.append(self.x[i]+self.vx[i+1]*self.dt)self.y.append(self.y[i]+self.vy[i+1]*self.dt)self.r.append(math.sqrt(self.x[i+1]**2+self.y[i+1]**2))self.w.append(self.w[i]-3*self.GM/self.r[i]**5*(self.x[i]*math.sin(self.theta[i])-self.y[i]*math.cos(self.theta[i]))*(self.x[i]*math.cos(self.theta[i])+self.y[i]*math.sin(self.theta[i]))*self.dt)self.theta.append(self.theta[i]+self.w[i+1]*self.dt)self.t.append(self.t[i]+self.dt)if self.theta[i+1]<-math.pi:self.theta[i+1]=self.theta[i+1]+2*math.piif self.theta[i+1]>math.pi:self.theta[i+1]=self.theta[i+1]-2*math.pidef show_results(self,color):ax1=plt.subplot(121)ax2=plt.subplot(122)plt.sca(ax1)plt.plot(self.t,self.theta,'m',label=r'Elliptical orbit')plt.title(r'Hyperion $\Theta$ versus time',fontsize=14)plt.xlabel(u'time(yr)',fontsize=14)plt.ylabel(u'$\Theta$(radians)',fontsize=14)plt.sca(ax2)plt.plot(self.t,self.w,'m',label=r'Elliptical orbit')plt.title(r'Hyperion $\omega$ versus time',fontsize=14)plt.xlabel(u'time(yr)',fontsize=14)plt.ylabel(u'$\omega$(radians/yr)',fontsize=14)#plt.xlim(-1,1)#plt.ylim(-1,1)plt.legend(fontsize=14,loc='best')a=hyperion()a.calculate()a.show_results('m')plt.show()
3.
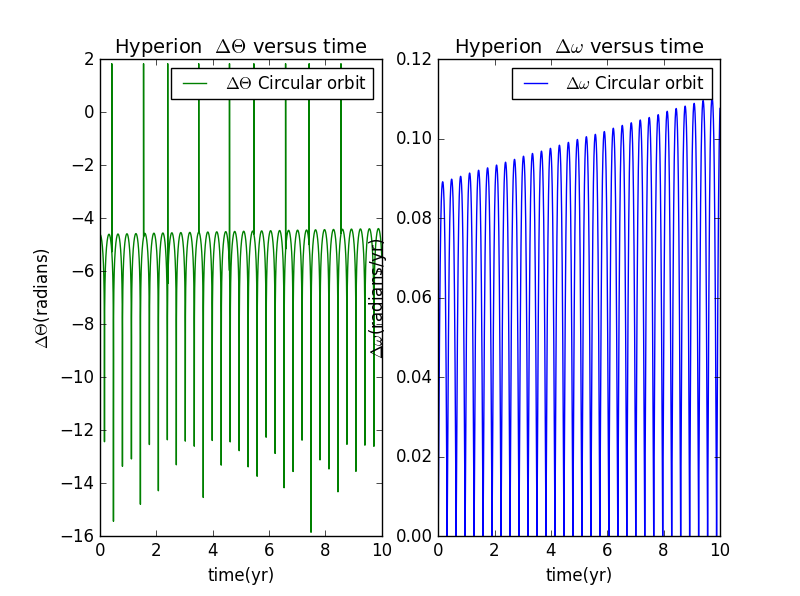
import matplotlib.pyplot as pltimport numpy as npimport mathclass hyperion:def __init__(self,GM=4*math.pi**2,dt=0.0001,time=10):self.GM=GMself.x=[[1],[1],[1],[1]]self.y=[[0],[0],[0],[0]]self.vx=[[0],[0],[0],[0]]self.vy=[[5.5],[5],[4],[3]]self.x1=[[1],[1],[1],[1]]self.y1=[[0],[0],[0],[0]]self.vx1=[[0],[0],[0],[0]]self.vy1=[[5.5],[5],[4],[3]]self.dt=dtself.time=timeself.r=[[math.sqrt(self.x[0][0]**2+self.y[0][0]**2)],[math.sqrt(self.x[1][0]**2+self.y[1][0]**2)],[math.sqrt(self.x[2][0]**2+self.y[2][0]**2)],[math.sqrt(self.x[3][0]**2+self.y[3][0]**2)]]self.t=[[0],[0],[0],[0]]self.w=[[0],[0],[0],[0]]self.theta=[[0.05],[0.05],[0.05],[0.05]]self.r1=[[math.sqrt(self.x1[0][0]**2+self.y1[0][0]**2)],[math.sqrt(self.x1[1][0]**2+self.y1[1][0]**2)],[math.sqrt(self.x1[2][0]**2+self.y1[2][0]**2)],[math.sqrt(self.x1[3][0]**2+self.y1[3][0]**2)]]self.t1=[[0],[0],[0],[0]]self.w1=[[0],[0],[0],[0]]self.theta1=[[0],[0],[0],[0]]self.d=[[math.log(abs(self.theta[0][0]-self.theta1[0][0]))],[math.log(abs(self.theta[1][0]-self.theta1[1][0]))],[math.log(abs(self.theta[2][0]-self.theta1[2][0]))],[math.log(abs(self.theta[3][0]-self.theta1[3][0]))]]self.dw=[[abs(self.w[0][0]-self.w1[0][0])],[abs(self.w[1][0]-self.w1[1][0])],[abs(self.w[2][0]-self.w1[2][0])],[abs(self.w[3][0]-self.w1[3][0])]]def calculate(self):for n in range(4):for i in range(int(self.time//self.dt)):self.vx[n].append(self.vx[n][i]-self.GM*self.x[n][i]*self.dt/self.r[n][i]**3)self.vy[n].append(self.vy[n][i]-self.GM*self.y[n][i]*self.dt/self.r[n][i]**3)self.x[n].append(self.x[n][i]+self.vx[n][i+1]*self.dt)self.y[n].append(self.y[n][i]+self.vy[n][i+1]*self.dt)self.r[n].append(math.sqrt(self.x[n][i+1]**2+self.y[n][i+1]**2))self.w[n].append(self.w[n][i]-3*self.GM/self.r[n][i]**5*(self.x[n][i]*math.sin(self.theta[n][i])-self.y[n][i]*math.cos(self.theta[n][i]))*(self.x[n][i]*math.cos(self.theta[n][i])+self.y[n][i]*math.sin(self.theta[n][i]))*self.dt)self.theta[n].append(self.theta[n][i]+self.w[n][i+1]*self.dt)self.t[n].append(self.t[n][i]+self.dt)if self.theta[n][i+1]<-math.pi:self.theta[n][i+1]=self.theta[n][i+1]+2*math.piif self.theta[n][i+1]>math.pi:self.theta[n][i+1]=self.theta[n][i+1]-2*math.piself.vx1[n].append(self.vx1[n][i]-self.GM*self.x1[n][i]*self.dt/self.r1[n][i]**3)self.vy1[n].append(self.vy1[n][i]-self.GM*self.y1[n][i]*self.dt/self.r1[n][i]**3)self.x1[n].append(self.x1[n][i]+self.vx1[n][i+1]*self.dt)self.y1[n].append(self.y1[n][i]+self.vy1[n][i+1]*self.dt)self.r1[n].append(math.sqrt(self.x1[n][i+1]**2+self.y1[n][i+1]**2))self.w1[n].append(self.w1[n][i]-3*self.GM/self.r1[n][i]**5*(self.x1[n][i]*math.sin(self.theta1[n][i])-self.y1[n][i]*math.cos(self.theta1[n][i]))*(self.x1[n][i]*math.cos(self.theta1[n][i])+self.y1[n][i]*math.sin(self.theta1[n][i]))*self.dt)self.theta1[n].append(self.theta1[n][i]+self.w1[n][i+1]*self.dt)self.t1[n].append(self.t1[n][i]+self.dt)if self.theta1[n][i+1]<-math.pi:self.theta1[n][i+1]=self.theta1[n][i+1]+2*math.piif self.theta1[n][i+1]>math.pi:self.theta1[n][i+1]=self.theta1[n][i+1]-2*math.piself.d[n].append(math.log(abs(self.theta[n][i]-self.theta1[n][i])))self.dw[n].append(abs(self.w[n][i]-self.w1[n][i]))def show_results(self,color):ax1=plt.subplot(221)ax2=plt.subplot(222)ax3=plt.subplot(223)ax4=plt.subplot(224)plt.sca(ax1)plt.plot(self.t[0],self.d[0],'g',label=r'd$\Theta$=0.05,v=5.5 Elliptical orbit')#plt.plot(self.t[0],self.dw[0],'b',label=r'd$\Theta$=0.05,v=5.5 Elliptical orbit')plt.title(r'Hyperion $\Delta{\Theta}$ versus time',fontsize=12)#plt.title(r'Hyperion $\Delta{\omega}$ versus time',fontsize=12)plt.xlabel(u'time(yr)',fontsize=12)plt.ylabel(u'$\Delta{\Theta}$(radians)',fontsize=12)#plt.ylabel(u'$\Delta{\omega}$(radians/yr)',fontsize=12)plt.legend(fontsize=10,loc='best')plt.sca(ax2)plt.plot(self.t[1],self.d[1],'g',label=r'd$\Theta$=0.05,v=5 Elliptical orbit')#plt.plot(self.t[1],self.dw[1],'b',label=r'd$\Theta$=0.05,v=5 Elliptical orbit')plt.title(r'Hyperion $\Delta{\Theta}$ versus time',fontsize=12)#plt.title(r'Hyperion $\Delta{\omega}$ versus time',fontsize=12)plt.xlabel(u'time(yr)',fontsize=12)plt.ylabel(u'$\Delta{\Theta}$(radians)',fontsize=12)#plt.ylabel(u'$\Delta{\omega}$(radians/yr)',fontsize=12)plt.legend(fontsize=10,loc='best')plt.sca(ax3)plt.plot(self.t[2],self.d[2],'g',label=r'd$\Theta$=0.05,v=4 Elliptical orbit')#plt.plot(self.t[2],self.dw[2],'b',label=r'd$\Theta$=0.05,v=4 Elliptical orbit')plt.title(r'Hyperion $\Delta{\Theta}$ versus time',fontsize=12)#plt.title(r'Hyperion $\Delta{\omega}$ versus time',fontsize=12)plt.xlabel(u'time(yr)',fontsize=12)plt.ylabel(u'$\Delta{\Theta}$(radians)',fontsize=12)#plt.ylabel(u'$\Delta{\omega}$(radians/yr)',fontsize=12)plt.legend(fontsize=10,loc='best')plt.sca(ax4)plt.plot(self.t[3],self.d[3],'g',label=r'd$\Theta$=0.05,v=3 Elliptical orbit')#plt.plot(self.t[3],self.dw[3],'b',label=r'd$\Theta$=0.05,v=3 Elliptical orbit')plt.title(r'Hyperion $\Delta{\Theta}$ versus time',fontsize=12)#plt.title(r'Hyperion $\Delta{\omega}$ versus time',fontsize=12)plt.xlabel(u'time(yr)',fontsize=12)plt.ylabel(u'$\Delta{\Theta}$(radians)',fontsize=12)#plt.ylabel(u'$\Delta{\omega}$(radians/yr)',fontsize=12)plt.legend(fontsize=10,loc='best')a=hyperion()a.calculate()a.show_results('b')plt.show()
三、图表
for circular and elliptical orbit,reset
and for circular and elliptical orbit reset
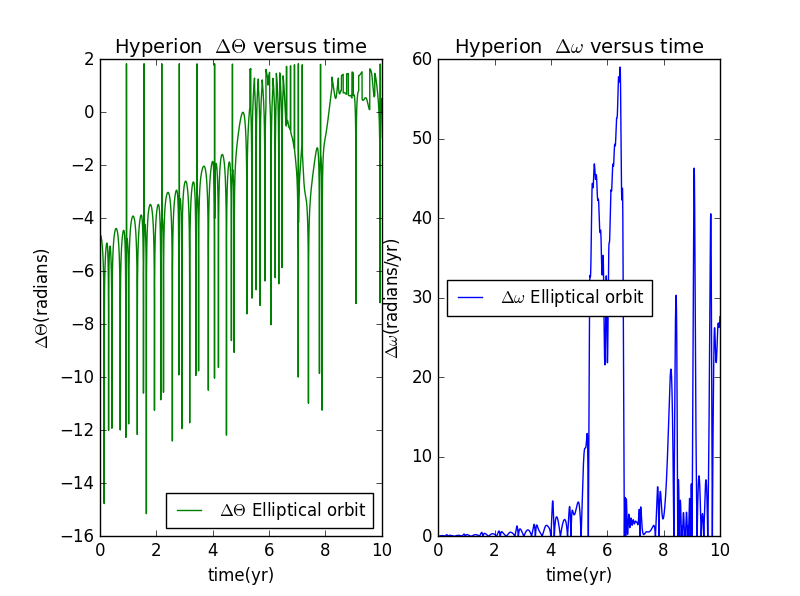
not keepin range fromtofor circular and elliptical orbit
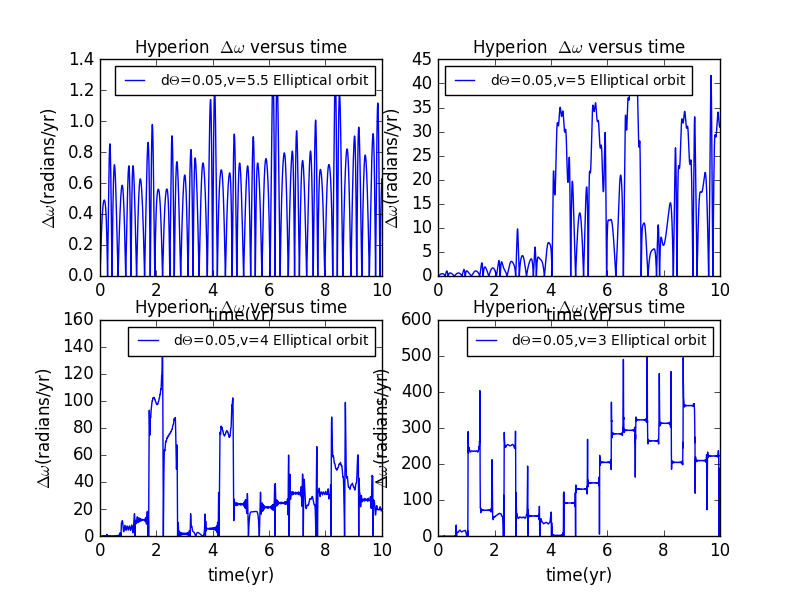
change the initial conditions
,change the initial velocity
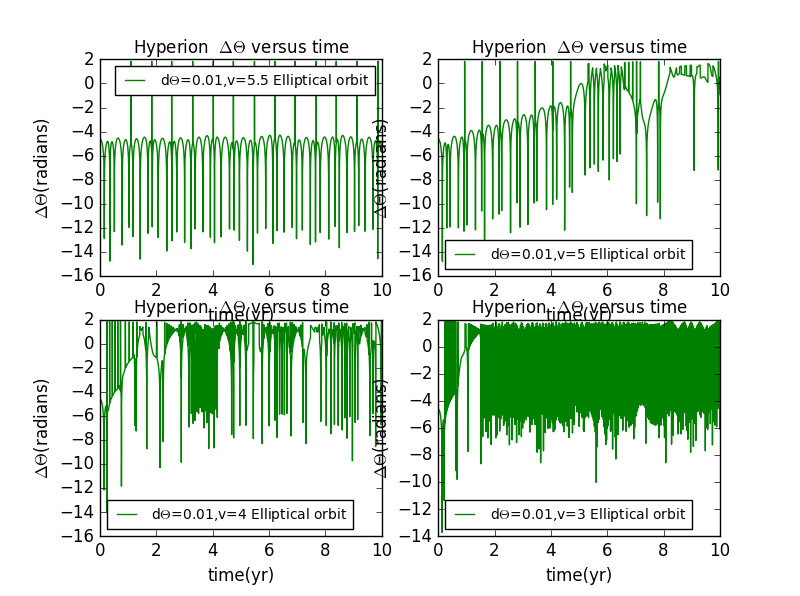
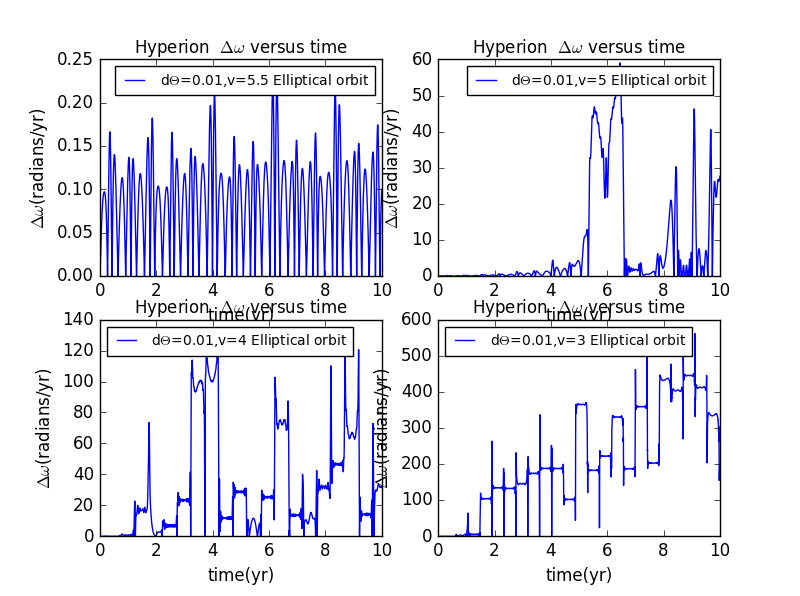
,change the initial velocity

感谢室友杜威提供的帮助
