@zifeng328573112
2021-03-17T11:15:56.000000Z
字数 2182
阅读 425
MPAndroidChart技术-开始 Getting Started(一)
一、使用
为了使用 LineChart, BarChart, ScatterChart, CandleStickChart, PieChart, BubbleChart or RadarChart ,要在.xml 文件定义:
<com.github.mikephil.charting.charts.LineChartandroid:id="@+id/chart"android:layout_width="match_parent"android:layout_height="match_parent" />
然后在 Activity 或 Fragment 中拿到你定义的 chart:
// in this example, a LineChart is initialized from xmlLineChart chart = (LineChart) findViewById(R.id.chart);
使用 java 代码创建它(如果不是在布局文件中定义,需要将其加入你的布局):
// programmatically create a LineChartLineChart chart = new LineChart(Context);// get a layout defined in xmlRelativeLayout rl = (RelativeLayout) findViewById(R.id.relativeLayout);rl.add(chart); // add the programmatically created chart
二、刷新
- invalidate() : 在chart中调用会使其刷新重绘
- notifyDataSetChanged() : 让chart知道它依赖的基础数据已经改变,并执行所有必要的重新计算(比如偏移量,legend,最大值,最小值…)。在动态添加数据时需要用到。
三、打印日志
- setLogEnabled(boolean enabled) : 设置为true将激活chart的logcat输出。但这不利于性能,如果不是必要的,应保持禁用。
四、基本chart风格
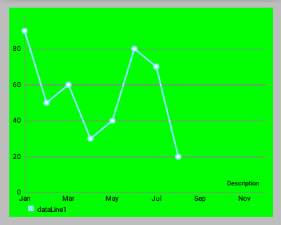
这里我们先定义一个LineChart范例:
<!--折线图,layout的背景色为 #bdbdbd 灰--><com.github.mikephil.charting.charts.LineChartandroid:id="@+id/line_chart"android:layout_width="match_parent"android:layout_height="300dp"android:background="#ffffff"android:layout_margin="16dp"/>

下面是一些可以直接在 chart 上使用的设置 style 的方法:
setBackgroundColor(int color): 设置背景颜色,将覆盖整个图表视图。此外,背景颜色可以在布局文件 .xml 中进行设置。
注意:设置颜色时要ARGB完整的八位(如0xff00ff00),否则可能会被视为“设置透明颜色”(如0xff0000)setDescription(String desc): 设置图表的描述文字,会显示在图表的右下角。setDescriptionColor(int color): 设置描述文字的颜色。
setDescriptionPosition(float x, float y): 自定义描述文字在屏幕上的位置(单位是像素)。setDescriptionTypeface(Typeface t): 设置描述文字的 Typeface。setDescriptionTextSize(float size): 设置以像素为单位的描述文字,最小6f,最大16f。
setNoDataTextDescription(String desc): 设置当 chart 为空时显示的描述文字。
setDrawGridBackground(boolean enabled): 如果启用,chart 绘图区后面的背景矩形将绘制。
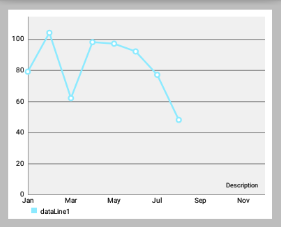
setGridBackgroundColor(int color): 设置网格背景应与绘制的颜色。

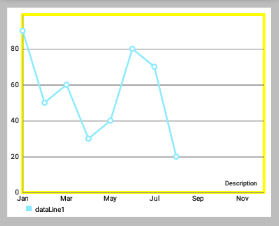
setDrawBorders(boolean enabled): 启用/禁用绘制图表边框(chart周围的线)。setBorderColor(int color): 设置 chart 边框线的颜色。setBorderWidth(float width): 设置 chart 边界线的宽度,单位 dp。
setMaxVisibleValueCount(int count): 设置最大可见绘制的chart count的数量。 只在setDrawValues()设置为true时有效。
