@zsh-o
2019-12-27T14:34:25.000000Z
字数 912
阅读 1311
PCA 只有代码
机器学习
%matplotlib inlineimport numpy as npimport scipyfrom matplotlib import pyplot as plt
points = np.random.randn(50, 2)
plt.scatter(points[:, 0], points[:, 1])
<matplotlib.collections.PathCollection at 0x7f378f2f7f50>
](http://static.zybuluo.com/zsh-o/cmjt1vrg1agzrv2gz4e8dykx/output_3_1.png)
cov = np.cov(points.T)cov.shape
(2, 2)
w, v = np.linalg.eig(cov)w, v
(array([0.95331384, 0.82559234]), array([[ 0.99782635, -0.06589818],
        [ 0.06589818,  0.99782635]]))
y_axis = v[np.argmax(w)]x_axis = v[np.argmin(w)]y_axis, x_axis
(array([ 0.99782635, -0.06589818]), array([0.06589818, 0.99782635]))
x = np.dot(points, x_axis)y = np.dot(points, y_axis)
x1 = np.dot(x.reshape(-1, 1), x_axis.reshape(1, -1))y1 = np.dot(y.reshape(-1, 1), y_axis.reshape(1, -1))
l = np.linspace(-1, 1)
lx = np.dot(l.reshape(-1, 1), x_axis.reshape(1, -1))ly = np.dot(l.reshape(-1, 1), y_axis.reshape(1, -1))
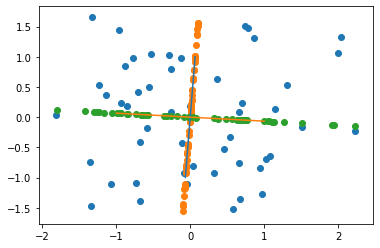
plt.scatter(points[:, 0], points[:, 1])plt.scatter(x1[:, 0], x1[:, 1])plt.scatter(y1[:, 0], y1[:, 1])plt.plot(lx[:, 0], lx[:, 1])plt.plot(ly[:, 0], ly[:, 1])
[<matplotlib.lines.Line2D at 0x7f378f2a79d0>]