@zsh-o
2020-02-14T03:56:51.000000Z
字数 11498
阅读 1520
centerline by snake
UII
%matplotlib inlineimport numpy as npfrom matplotlib import pyplot as plt
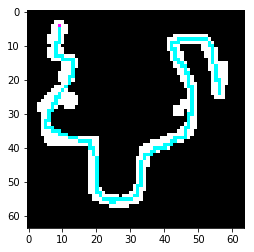
im_demo = plt.imread('demo1.png')im_demo = 1 - im_demo
plt.imshow(im_demo)
<matplotlib.image.AxesImage at 0x1b0bccb6cf8>
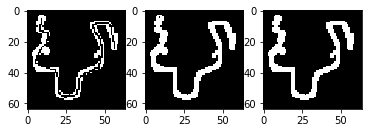
plt.subplot(1,3,1)plt.imshow(im_demo[:,:,0], cmap=plt.cm.gray)plt.subplot(1,3,2)plt.imshow(im_demo[:,:,1], cmap=plt.cm.gray)plt.subplot(1,3,3)plt.imshow(im_demo[:,:,2], cmap=plt.cm.gray)
<matplotlib.image.AxesImage at 0x1b0bcdab4e0>
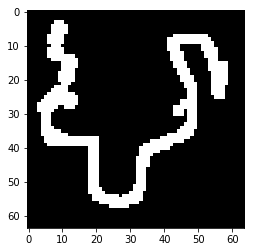
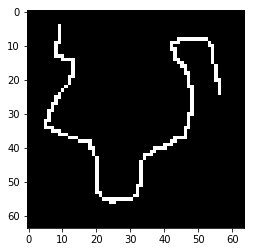
im_mask = (im_demo[:, :, 2] > 0).astype(np.uint8)
plt.imshow(im_mask, cmap=plt.cm.gray)
<matplotlib.image.AxesImage at 0x1b0bce2e0f0>
im_centerline = np.logical_and(np.logical_or(im_demo[:, :, 0] < 1, im_demo[:, :, 1] < 1), im_demo[:, :, 2] > 0).astype(np.uint8)
plt.imshow(im_centerline, cmap=plt.cm.gray)
<matplotlib.image.AxesImage at 0x1b0bce85eb8>
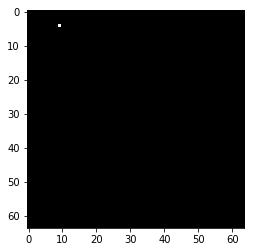
im_start = np.logical_and(im_demo[:, :, 1] < 1, im_demo[:, :, 2] > 0).astype(np.uint8)
plt.imshow(im_start, cmap=plt.cm.gray)
<matplotlib.image.AxesImage at 0x1b0bcee7a58>
Some Utils
def get_rotation_matrix(vector_from, vector_to):if isinstance(vector_from, list) is True:vector_from = np.array(vector_from)if isinstance(vector_to, list) is True:vector_to = np.array(vector_to)vector_from = np.array([vector_from[0], vector_from[1], 0])vector_from = vector_from / np.sqrt(np.sum(vector_from ** 2))vector_to = np.array([vector_to[0], vector_to[1], 0])vector_to = vector_to / np.sqrt(np.sum(vector_to ** 2))vector_rotation = np.cross(vector_from, vector_to)angle = np.arccos(np.dot(vector_from, vector_to))if vector_rotation[2] > 0:return np.array([[np.cos(angle), -np.sin(angle)],[np.sin(angle), np.cos(angle)]])else:return np.array([[np.cos(angle), np.sin(angle)],[-np.sin(angle), np.cos(angle)]])
np.dot(get_rotation_matrix([0,1], [0,-1]), np.array([-1, 0]))
array([1.0000000e+00, 1.2246468e-16])
def resample_nn(im, coordinate, resample_ratio=0):width = im.shape[0]height = im.shape[1]if isinstance(coordinate, list):coordinate = np.array(coordinate)if coordinate[0] < 0 or coordinate[1] >= width:return 0if coordinate[1] < 0 or coordinate[1] >= height:return 0coordinate = coordinate + 0.5 - resample_ratio / 2coordinate_floor = np.floor(coordinate)is_larger = (coordinate - coordinate_floor) > 0.5larger_x, larger_y = is_larger[0], is_larger[1]x, y = int(coordinate_floor[0] + 0.1), int(coordinate_floor[1] + 0.1)if larger_x is True:x += 1x = min(x, width - 1)if larger_y is True:y += 1y = min(y, height - 1)return im[x, y]
resample_nn(im_mask, [40, 20])
1
def resample_line_by_center(im, center, direction, step=0.15, size=51):assert size % 2 != 0if isinstance(center, list):center = np.array(center)if isinstance(direction, list):direction = np.array(direction)center = center.astype(np.float)line = []i = 0curr = center.copy()while i < size // 2:curr = center - (direction * step * (size // 2 - i))line.append(resample_nn(im, curr, step))i += 1line.append(resample_nn(im, center, step))i = 0curr = center.copy()while i < size // 2:curr = center + (direction * step * (i + 1))line.append(resample_nn(im, curr, step))i += 1return np.array(line)def resample_line_by_center_debug(im, center, direction, step=0.15, size=51):assert size % 2 != 0if isinstance(center, list):center = np.array(center)if isinstance(direction, list):direction = np.array(direction)center = center.astype(np.float)line = []i = 0curr = center.copy()while i < size // 2:curr = center - (direction * step * (size // 2 - i))line.append(curr)i += 1line.append(center)i = 0curr = center.copy()while i < size // 2:curr = center + (direction * step * (i + 1))line.append(curr)i += 1return np.vstack(line)
resample parameters
resample_ratio = 0.15resample_size = 51
line = resample_line_by_center(im_mask, [50, 20], [0, 1], resample_ratio, resample_size)line
array([0, 0, 0, 0, 0, 0, 0, 0, 0, 1, 1, 1, 1, 1, 1, 1, 1, 1, 1, 1, 1, 1,
       1, 1, 1, 1, 1, 1, 1, 0, 0, 0, 0, 0, 0, 0, 0, 0, 0, 0, 0, 0, 0, 0,
       0, 0, 0, 0, 0, 0, 0], dtype=uint8)
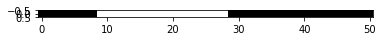
plt.imshow(line.reshape((1, -1)), cmap=plt.cm.gray)
<matplotlib.image.AxesImage at 0x1b0bcf4cc88>
plt.imshow(im_mask, cmap=plt.cm.gray)plt.scatter(20, 50)line_debug = resample_line_by_center_debug(im_mask, [50, 20], [0, 1], resample_ratio, resample_size)plt.plot(line_debug[:, 1], line_debug[:, 0])
[<matplotlib.lines.Line2D at 0x1b0bcf99f60>]
def get_centerline(im_centerline, im_start):im_centerline = im_centerline.copy()width = im_centerline.shape[0]height = im_centerline.shape[1]centerline = []point_start = np.vstack(np.where(im_start > 0)).Tcurr = point_startwhile True:centerline.append(curr)x, y = curr[0, 0], curr[0, 1]im_centerline[x, y] = 0found = Falsefor dx in range(-1, 2):nx = x + dxif nx < 0 or nx >= width:continuefor dy in range(-1, 2):ny = y + dyif ny < 0 or ny >= height:continueif im_centerline[nx, ny] > 0:found = Truecurr = np.array([[nx, ny]])breakif found is True:breakif found is not True:breakreturn np.concatenate(centerline, axis=0)
centerline = get_centerline(im_centerline, im_start)centerline.shape
(164, 2)
im_centerline_copy = np.zeros(im_centerline.shape, dtype=np.uint8)
for i in range(centerline.shape[0]):point = centerline[i]im_centerline_copy[point[0], point[1]] = 1
plt.subplot(1, 2, 1)plt.imshow(im_centerline, cmap=plt.cm.gray)plt.subplot(1, 2, 2)plt.imshow(im_centerline_copy, cmap=plt.cm.gray)
<matplotlib.image.AxesImage at 0x1b0bd039a58>
# smoothfrom scipy.interpolate import splprep, splev
tck, u = splprep([centerline[:, 0], centerline[:, 1]], s=5)unew = np.arange(0, 1, 1 / 200)centerline = np.vstack(splev(unew, tck)).T
plt.imshow(im_mask, cmap=plt.cm.gray)plt.plot(centerline[:,1], centerline[:, 0])
[<matplotlib.lines.Line2D at 0x1b0bd97c2b0>]
def get_norm(centerline):assert centerline.shape[0] >= 2diff = []for i in range(centerline.shape[0]):if i == 0:left = centerline[i]else:left = centerline[i - 1]if i == centerline.shape[0] - 1:right = centerline[i]else:right = centerline[i + 1]d = right - leftd = d / np.sqrt(np.sum(d ** 2))diff.append(d.reshape(1, -1))return np.concatenate(diff, axis=0)
norms = get_norm(centerline)
index = 175
point = centerline[index]norm = norms[index]point, norm
(array([ 7.98154137, 48.3591225 ]), array([0.04317411, 0.99906756]))
rotation_matrix = get_rotation_matrix([0, 1], norm)
rotation_matrix
array([[ 0.99906756,  0.04317411],
       [-0.04317411,  0.99906756]])
direction = np.dot(rotation_matrix, np.array([1, 0]))
direction
array([ 0.99906756, -0.04317411])
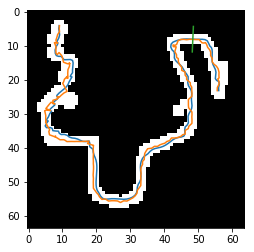
line_debug = resample_line_by_center_debug(im_mask, point, direction, resample_ratio, resample_size)
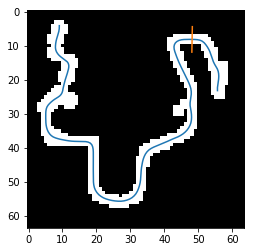
plt.imshow(im_mask, cmap=plt.cm.gray)plt.plot(centerline[:,1], centerline[:, 0])plt.plot(line_debug[:, 1], line_debug[:, 0])
[<matplotlib.lines.Line2D at 0x1b0bda0acf8>]
line = resample_line_by_center(im_mask, point, direction, resample_ratio, resample_size)line
array([0, 0, 0, 0, 0, 0, 0, 0, 0, 0, 0, 0, 0, 0, 0, 0, 1, 1, 1, 1, 1, 1,
       1, 1, 1, 1, 1, 1, 1, 1, 1, 1, 1, 1, 1, 1, 0, 0, 0, 0, 0, 0, 0, 0,
       0, 0, 0, 0, 0, 0, 0], dtype=uint8)
plt.imshow(line.reshape((1, -1)), cmap=plt.cm.gray)
<matplotlib.image.AxesImage at 0x1b0bda6db00>
def get_mass(line, center):if line[center] == 0:return 0L = line.shape[0]ret = [0]sum = 0N = 1i = 1while i + center < L:if line[i + center] > 0:sum += iN += 1else:breaki += 1i = -1while i + center >= 0:if line[i + center] > 0:sum += iN += 1else:breaki -= 1return sum / N
mass = get_mass(line, (resample_size + 1) // 2 - 1)mass
0.5
plt.imshow(line.reshape((1, -1)), cmap=plt.cm.gray)c = (resample_size + 1) // 2 - 1plt.scatter(c, 0, c='r')plt.scatter(c + mass, 0, c='g')
<matplotlib.collections.PathCollection at 0x1b0bea960f0>

def get_refine_center(im_mask, centerpoint, norm, ratio=0.15, size=51):rotation_matrix = get_rotation_matrix([0, 1], norm)direction = np.dot(rotation_matrix, np.array([1, 0]))line = resample_line_by_center(im_mask, centerpoint, direction, ratio, size)mass = get_mass(line, (size + 1) // 2 - 1)refinepoint = centerpoint + direction * mass * ratioreturn refinepoint
get_refine_center(im_mask, point, norm, resample_ratio, resample_size)
array([ 8.05647143, 48.35588444])
def get_refine_centerline(im, centerline, resmaple_ratio=0.15, resample_size=51):norms = get_norm(centerline)ret = []for i in range(centerline.shape[0]):r = get_refine_center(im, centerline[i], norms[i], resample_ratio, resample_size)ret.append(r.reshape(1, -1))return np.concatenate(ret)
refine_centerline = get_refine_centerline(im_mask, centerline, resample_ratio, resample_size)
plt.imshow(im_mask, cmap=plt.cm.gray)plt.plot(centerline[:,1], centerline[:, 0])plt.plot(refine_centerline[:,1], refine_centerline[:, 0])plt.plot(line_debug[:, 1], line_debug[:, 0])
[<matplotlib.lines.Line2D at 0x1b0beaf5f60>]
Snake
alpha = 0.1beta = 0.5omega = 0.1gamma = 5iters = 50
def build_A(alpha, beta, N):A = np.zeros((N, N))for i in range(N):if i == 0 or i == 1 or i == N - 1 or i == N - 2:continueA[i, i-2] = -betaA[i, i-1] = alpha + 4 * betaA[i, i] = -2 * alpha - 6 * betaA[i, i+1] = alpha + 4 * betaA[i, i+2] = -betareturn A
A = build_A(alpha, beta, centerline.shape[0])
A
array([[ 0. ,  0. ,  0. , ...,  0. ,  0. ,  0. ],
       [ 0. ,  0. ,  0. , ...,  0. ,  0. ,  0. ],
       [-0.5,  2.1, -3.2, ...,  0. ,  0. ,  0. ],
       ...,
       [ 0. ,  0. ,  0. , ..., -3.2,  2.1, -0.5],
       [ 0. ,  0. ,  0. , ...,  0. ,  0. ,  0. ],
       [ 0. ,  0. ,  0. , ...,  0. ,  0. ,  0. ]])
IA = np.linalg.inv(np.eye(centerline.shape[0]) - A * gamma)IA
array([[ 1.00000000e+00,  7.10542736e-16,  0.00000000e+00, ...,
         9.27301538e-70, -2.22552369e-68,  0.00000000e+00],
       [ 2.64338815e-16,  1.00000000e+00,  0.00000000e+00, ...,
         1.65589560e-68, -9.71458754e-68,  8.83144322e-69],
       [-2.92482759e-01,  9.50440213e-01,  1.16993104e-01, ...,
         1.79323709e-54, -2.19623057e-53, -4.48309274e-54],
       ...,
       [-4.48309274e-54, -2.19623057e-53,  1.79323709e-54, ...,
         1.16993104e-01,  9.50440213e-01, -2.92482759e-01],
       [ 0.00000000e+00,  0.00000000e+00,  0.00000000e+00, ...,
         0.00000000e+00,  1.00000000e+00,  0.00000000e+00],
       [ 0.00000000e+00,  0.00000000e+00,  0.00000000e+00, ...,
         0.00000000e+00,  0.00000000e+00,  1.00000000e+00]])
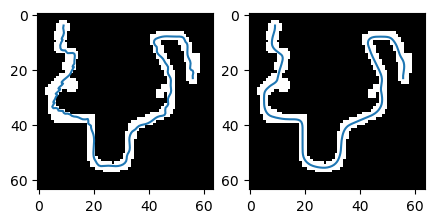
curr_centerline = centerline.copy()History = [centerline]for i in range(iters):refine_centerline = get_refine_centerline(im_mask, curr_centerline, resample_ratio, resample_size)centerline_diff = refine_centerline - curr_centerlinecurr_centerline = np.dot(IA, curr_centerline + centerline_diff * gamma * omega)History.append(curr_centerline)
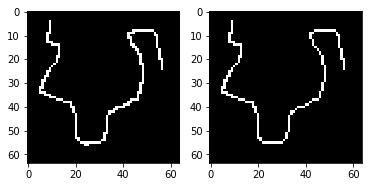
final_centerline = History[-1]origin_centerline = History[0]plt.figure(figsize=(5,10), dpi=100)plt.subplot(1, 2, 1)plt.imshow(im_mask, cmap=plt.cm.gray)plt.plot(origin_centerline[:, 1], origin_centerline[:, 0])plt.subplot(1, 2, 2)plt.imshow(im_mask, cmap=plt.cm.gray)plt.plot(final_centerline[:,1], final_centerline[:, 0])
[<matplotlib.lines.Line2D at 0x1b0beb9eb00>]
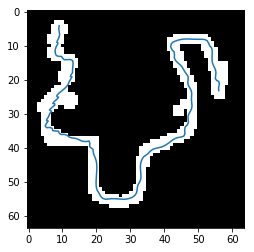
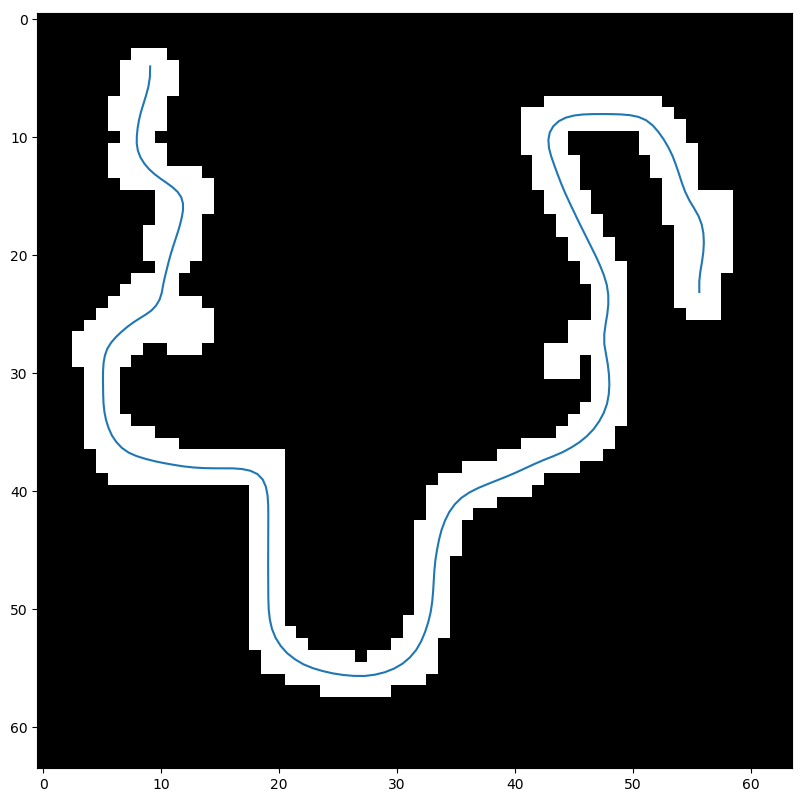
plt.figure(figsize=(10, 10), dpi=100)plt.imshow(im_mask, cmap=plt.cm.gray)plt.plot(final_centerline[:,1], final_centerline[:, 0])
[<matplotlib.lines.Line2D at 0x1b0bedd1dd8>]
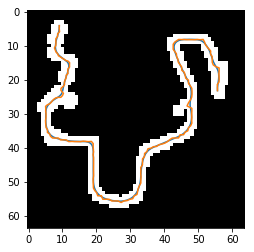
final centerline and its refine centerline for debug
final_refine = get_refine_centerline(im_mask, final_centerline)
plt.imshow(im_mask, cmap=plt.cm.gray)plt.plot(final_centerline[:, 1], final_centerline[:, 0])plt.plot(final_refine[:,1], final_refine[:, 0])
[<matplotlib.lines.Line2D at 0x1b0bec2f5c0>]
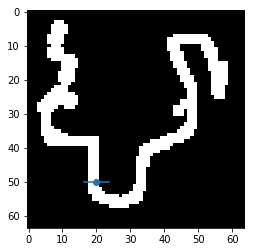
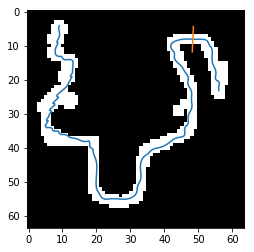
final_norms = get_norm(final_centerline)point = final_centerline[index]norm = final_norms[index]rotation_matrix = get_rotation_matrix([0, 1], norm)direction = np.dot(rotation_matrix, np.array([1, 0]))final_line_debug = resample_line_by_center_debug(im_mask, point, direction, resample_ratio, resample_size)
plt.imshow(im_mask, cmap=plt.cm.gray)plt.plot(final_centerline[:,1], final_centerline[:, 0])plt.plot(final_line_debug[:, 1], final_line_debug[:, 0])
[<matplotlib.lines.Line2D at 0x1b0bec91400>]
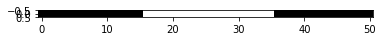
final_line = resample_line_by_center(im_mask, point, direction, resample_ratio, resample_size)mass = get_mass(final_line, (resample_size + 1) // 2 - 1)
plt.imshow(final_line.reshape((1, -1)), cmap=plt.cm.gray)c = (resample_size + 1) // 2 - 1plt.scatter(c, 0, c='r')plt.scatter(c + mass, 0, c='g')
<matplotlib.collections.PathCollection at 0x1b0becfa160>