@betasy
2014-12-26T08:04:28.000000Z
字数 1181
阅读 1362
组会 2014-12-26 星期五 晴转多云
GIS 组会
- 朱杰 skyline 三维模型实现
使用云接口实现功能,鸟瞰,地形叠加。
添加建筑物模型,查询地点
能否实现洪水淹没模型?
屠卫平等已经做过,可以用于借鉴。
接下来完善功能,二级界面开发 - 阿宾哥
ICESAT 数据解译2009年10月11号
总共15级数据,现在用到1~14级数据。
首先应该确保数据有用。check其他国家大城市。
但是卫星轨迹不一
introduction:
ICESat (Ice, Cloud,and land Elevation Satellite) was the benchmark Earth Observing System mission for measuring ice sheet mass balance, cloud and aerosol heights, as well as land topography and vegetation characteristics. From 2003 to 2009, the ICESat mission provided multi-year elevation data needed to determine ice sheet mass balance as well as cloud property information, especially for stratospheric clouds common over polar areas. It also provided topography and vegetation data around the globe, in addition to the polar-specific coverage over the Greenland and Antarctic ice sheets.
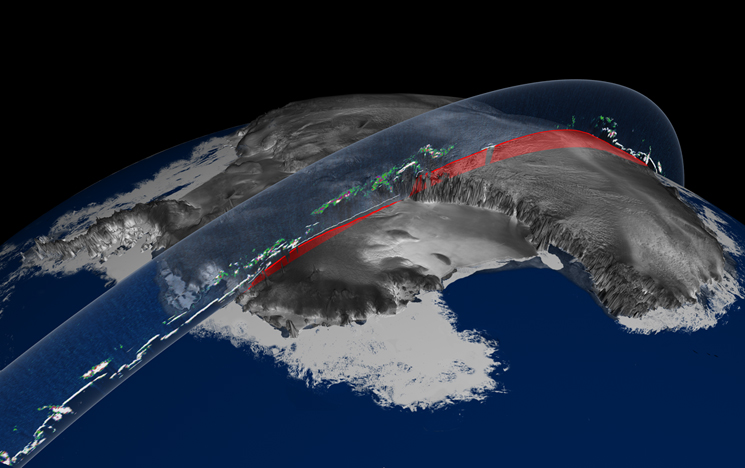
图1 ICESAT卫星
3.唐敏 城市群提取和识别
a cluster based ... yuyu zhou
环境遥感上的文章
中国和美国城市发展代表了两个主要典型情况。中国贫富悬殊,而美国较平均
先提取城市群(标记分水岭算法),认为城市群是像素想死且连续的像元族
对比三十米的影像,分割城市群确定合适的阈值。使用现在的阈值与模型阈值做差得到X。
城市群提取:提取灰度梯度影像(多尺度、边缘)--灰度梯度图像重建--标记前景和背景--分水岭标记
watershed()结果不太好,原因不明。
寻找最佳阈值 分类,resample,aggregation,reclassify.
logistic model:
NTL是整个研究区的灯光最大值/最小值
——最后得到最合适的城市群尺寸
point:使用全区土地利用类型数据辅助获取合适阈值,佐证城市群提取结果是有问题的。怎么能用更好的数据来得到一个粗糙的数据呢?我觉得这个是有问题的!
4.邓顺强
5.黄益修
6.吴君涵
7.虞思逸
8.贾颖芳 文献综述
