@cdmonkey
2025-08-28T01:46:19.000000Z
字数 5188
阅读 2548
Prometheus
Prometheus
https://github.com/prometheus/prometheus
https://toutiao.io/posts/lku237/preview
https://segmentfault.com/a/1190000007040144
https://www.hi-linux.com/posts/25047.html
https://songjiayang.gitbooks.io/prometheus/content
Install
首先要进行时间同步,因为时序数据对系统时间的准确性要求较高,因而必须要保证本机时间实时同步。
# 设定正确时区:[root@test02 ~]# timedatectl set-timezone Asia/Shanghai# 设定时间同步定时任务:*/5 * * * * /usr/sbin/ntpdate 1.cn.pool.ntp.org &> /dev/null
安装很简单,直接解压就行了。
[root@test02 ~]# mkdir -pv /opt[root@test02 ~]# cd tools/[root@test02 tools]# tar zxvf prometheus-2.6.0.linux-amd64.tar.gz -C /opt/[root@test02 tools]# cd /opt/[root@test02 opt]# ln -s prometheus-2.6.0.linux-amd64 prometheus
验证安装
[root@test02 ~]# cd /opt/prometheus[root@test02 prometheus]# ./prometheus --versionprometheus, version 2.4.3 (branch: HEAD, revision: 167a4b4e73a8eca8df648d2d2043e21bdb9a7449)build user: root@1e42b46043e9build date: 20181004-08:42:02go version: go1.11.1
Configure
于 prometheus 目录下有一个名为 prometheus.yml 的主配置文件。其中包含大多数标准配置及自检控配置,默认配置文件如下:
# my global configglobal:scrape_interval: 15s # 设定采集数据之时间间隔为十五秒。缺省值为一分钟。evaluation_interval: 15s # 每十五秒评估一次规则。就是监控规则评估频率。缺省值为一分钟。# scrape_timeout 设置为全局默认值(10s)。# 报警管理配置,暂未使用,先保留缺省配置。alerting:alertmanagers:- static_configs:- targets:# - alertmanager:9093# 载入规则一次,并根据全局 evaluation_interval 定期评估它们。rule_files:# - "first_rules.yml"# - "second_rules.yml"# 这里就表示对于采集对象进行配置。# 这里是采集 Promethues 自身数据的配置:scrape_configs:- job_name: 'prometheus'# metrics_path defaults to '/metrics'# scheme defaults to 'http'.static_configs:- targets: ['localhost:9090']# 这个自带的默认监控用于监控 prometheus 状态- job_name: 'jr_servers'static_configs:- targets: ['18.10.30.2:9100','18.10.30.3:9100','18.10.30.4:9100','18.10.30.5:9100','18.10.30.6:9100','18.10.30.7:9100']# 这部分是监控节点主机状态,需要在机器节点启动node_exporter
所谓监控规则评估,就是普罗米修斯多长时间会进行一次监控规则评估。
# 例如当内存使用率 >70% 时触发报警。这么这样一条规则,普罗米修斯多久会评估一次。# 所谓评估,就是判断收集到的监控数据是否符合这个规则。
生产场景实例:
- job_name: 'aliyun'static_configs:- targets: ['server01:9100','server02:9100','nginx06:9100','redis01:9100']
能够看到,targets 中能够并列写入多个监控节点,使用逗号隔开,主机名+端口号。其中:
- 主机名需要能够解析到;
- 端口号通常就是 Exporter 的端口。
至此,普罗米修斯就能够识别监控节点,开始持续采集监控数据。
Create user
这里创建一个专门用于运行 prometheus 之用户,不使用根用户运行是一个良好习惯。
家目录设定为 /var/lib/prometheus,用作数据目录。
groupadd prometheususeradd -g prometheus -m -d /var/lib/prometheus -s /sbin/nologin prometheus# 目录权限配置:chown prometheus.prometheus -R /opt/prometheus-2.6.0.linux-amd64
生产场景:
groupadd prometheususeradd -g prometheus -m -d /data/prometheus -s /sbin/nologin prometheuschown prometheus.prometheus -R /opt/prometheus-2.4.3.linux-amd64
Create Systemd Service
创建系统服务,方便启停及重启。
[root@test02 ~]# vim /etc/systemd/system/prometheus.service[Unit]Description=prometheusAfter=network.target[Service]Type=simpleUser=prometheusExecStart=/opt/prometheus/prometheus --config.file=/opt/prometheus/prometheus.yml --storage.tsdb.path=/var/lib/prometheusRestart=on-failureLimitNOFILE=100000LimitNPROC=100000[Install]WantedBy=multi-user.target
说明:
--storage.tsdb.path是可选配置,缺省数据目录位于运行目录的./data目录。
注意:若是指令了数据目录,请确保这个目录存在并且权限配置正确。
chown prometheus.prometheus /var/lib/prometheus
Startup Prometheus
[root@test02 ~]# systemctl start prometheus
验证是否启动成功:
[root@test02 ~]# systemctl status prometheus...prometheus[18725]: level=info ts=2018-11-21T01:51:50.493134731Z caller=main.go:523 msg="Server is ready to receive web requests."[root@test02 ~]# netstat -lntup |grep prometheustcp6 0 0 :::9090 :::* LISTEN 18725/prometheus
访问自带Web
Prometheus 自带一个比较简单的 Web,能够查看表达式搜索结果、报警配置、prometheus 配置,Exporter 状态等。自带页面默认地址 http://ip:9090。
安装非常简单,访问 Web 页面时甚至是不需要身份认证。若是需要这个功能,可使用
httppass工具。
删除数据
curl -X POST -g 'http://localhost:9090/api/v1/admin/tsdb/delete_series?match[]={kubernetes_name="redis"}'
重载配置
Exporter
https://github.com/prometheus/node_exporter
https://1byte.pro/devops/deploy-node-exporter-by-ansible.html
Install
首先是安装 node_exporter,它用于收集服务器之系统数据,这里采用普罗米修斯官方 Exporter,另外,官方还提供了一些其他 Exporter,具体可查看官网。
[root@test02 tools]# tar zxvf node_exporter-0.17.0.linux-amd64.tar.gz -C /opt/[root@test02 tools]# cd /opt/[root@test02 opt]# ln -s node_exporter-0.17.0.linux-amd64/ node_exporter# 配置目录权限:chown -R prometheus.prometheus /opt/node_exporter-0.17.0.linux-amd64
生产场景:
useradd -M -s /sbin/nologin exporterchown -R exporter.exporter /opt/node_exporter-0.17.0.linux-amd64
Create Systemd Service
[root@test02 ~]# vim /etc/systemd/system/node_exporter.service[Unit]Description=node_exporterDocumentation=https://prometheus.io/After=network.target[Service]Type=simpleUser=prometheusExecStart=/opt/node_exporter/node_exporterRestart=on-failure[Install]WantedBy=multi-user.target
注意:User=prometheus 要依照实际情况进行调整。
启动服务:
[root@test02 ~]# systemctl start node_exporter[root@test02 ~]# systemctl status node_exporter...level=info msg="Listening on :9100" source="node_...go:111"[root@test02 ~]# netstat -lntup|grep node_exportertcp6 0 0 :::9100 :::* LISTEN 18789/node_exporter
服务启动后,能够于其他主机上使用 curl 172.16.138.75:9100/metrics 指令进行检测。正常情况下会返回一大堆监控信息。
这些信息的 key 可直接用于普罗米修斯的命令行中。
Grafana
主要是用于图形展示。
[root@test02 tools]# yum localinstall grafana-5.4.2-1.x86_64.rpm
[root@test02 ~]# vim /etc/grafana/grafana.ini
注意,若是改变数据存储路径,需要确保目录存在。
mkdir -pv /data/grafanachown grafana.grafana /data/grafana
启动服务:
[root@test02 ~]# systemctl start grafana-server[root@test02 ~]# netstat -lntup|grep grafanatcp6 0 0 :::3000 :::* LISTEN 18071/grafana-serve
Add data source
登录 web 页面。
# Name: 起个名字# Type: Prometheus# URL: http://localhost:9090# Access: Server (Default)
注意:新版本缺省管理员账号及密码都是
admin,且登陆后需要设定新密码。
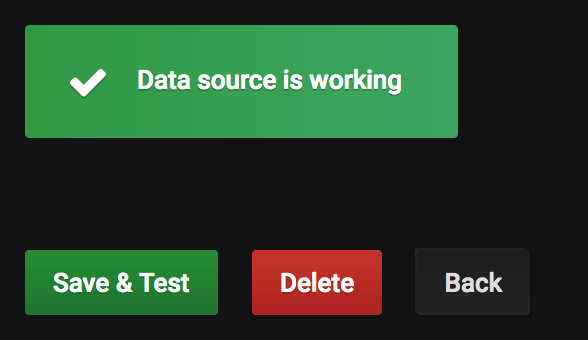
若是无需身份认证,则直接点击 Save & Test 即可。
| Img | Info |
|---|---|
 |
