@cdmonkey
2017-08-30T03:18:50.000000Z
字数 4656
阅读 1524
ELK-2-LogStash
ELK
LogStash
http://my.oschina.net/abcfy2/blog/372138
Install JDK
省略
Install LogStash
http://soft.dog/2016/01/05/logstash-basic/#section-5
# Set hosts:[root@ls-node1 ~]# cat /etc/hosts...172.16.1.23 ls-node1------------------[root@ls-node1 tools]# tar zxvf logstash-2.3.2.tar.gz[root@ls-node1 tools]# mv logstash-2.3.2 /usr/local/logstash
YUM Install: https://www.elastic.co/guide/en/logstash/current/package-repositories.html
通过前台启动服务:
[root@ls-node1 ~]# /usr/local/logstash/bin/logstash -e 'input {stdin{}} output {stdout{}}'Settings: Default pipeline workers: 1Pipeline main started# 输入什么内容,随后就会输出什么内容:hehe2016-06-16T02:21:35.618Z ls-node1 hehe------------------# 我们能够于输出中设定参数改变输出的格式:[root@ls-node1 ~]# /usr/local/logstash/bin/logstash -e 'input {stdin{}} output {stdout{ codec => rubydebug }}'Settings: Default pipeline workers: 1Pipeline main startedhello world{"message" => "hello world","@version" => "1","@timestamp" => "2016-06-16T02:18:43.019Z","host" => "ls-node1"}
我们同样能够将输入的内容直接写入到ES中去:
[root@ls-node1 ~]# /usr/local/logstash/bin/logstash -e 'input {stdin{}} output {elasticsearch { hosts => "172.16.1.21" }}'Settings: Default pipeline workers: 1Pipeline main startedcdmonkey
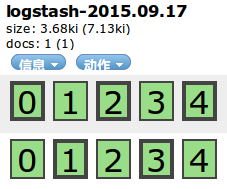
我们这时可以通过“head”插件发现新生成了一个索引,证明上面输入的内容被存放到ES中去了,如图所示。
后台运行(当然,如果是通过YUM进行安装的话就无需该操作):无论是使用根用户还是使用普通用户,启动脚本均需要进行修改,而且相应的用户必须要安装好“JDK”。
# Copy the startup script:[root@ls-node1 ~]# mv logstash.init /etc/init.d/logstash[root@ls-node1 ~]# chmod +x /etc/init.d/logstash# 注意该启动脚本的部分内容要根据实际的安装情况进行修改:# Use root:[root@ls-node1 ~]# vim /etc/init.d/logstashexport JAVA_HOME=/root/jdk1.8.0_25 # The JAVA_HOME of rootPATH="$JAVA_HOME/bin:$JAVA_HOME/jre/bin:$PATH:$HOMR/bin"export PATH...LS_USER=rootLS_GROUP=rootLS_HOME=/usr/local/logstashLS_HEAP_SIZE="128m"LS_LOG_DIR=/usr/local/logstashLS_CONF_DIR=/etc/logstash.confprogram=/usr/local/logstash/bin/logstash# 如果是使用普通用户的话需要添加用户并配置好JDK。# Add a user:[root@ls-node1 ~]# useradd logstash# 配置文件需要相应的进行修改:export JAVA_HOME=/home/logstash/jdk1.8.0_25...LS_USER=logstashLS_GROUP=logstash
注意:无论使用什么用户,都要确保对于输入源有读取的权限,而对于输出目标有写入的权限。
Configure Logstash
https://www.elastic.co/guide/en/logstash/current/configuration.html
对Logstash进行设置:必须有一个输入以及输出,这两者是必备的,而这两者的具体设定请参见官方文档。
#For example: /etc/logstash.conf[root@ls-node1 ~]# vim /etc/logstash.conf#指定输入内容,在此处我们指定了日志文件作为输入:input {file {path => "/var/log/messages"}}#我们在下面同时指定了两个输出(即日志被压缩保存的同时也会发送到ES进行处理):output {file {path => "/tmp/%{+YYYY-MM-dd}.messages.gz"gzip => true}elasticsearch {hosts => "172.16.1.21"index => "system-messages-%{+YYYY.MM.dd}"}}-------------# Test Configure file:[root@ls-node1 ~]# /usr/local/logstash/bin/logstash -t /etc/logstash.conf --testconfig# OR:[root@redis-node1 ~]# /etc/init.d/logstash configtestConfiguration OK
上面的设定文件检测我认为比较鸡肋,总之设定内容有问题的话服务就无法正常启动。
处理好设置文件后我们就通过前面的启动脚本启动LS服务了:
[root@Node-A1 ~]# /etc/init.d/logstash startlogstash started.
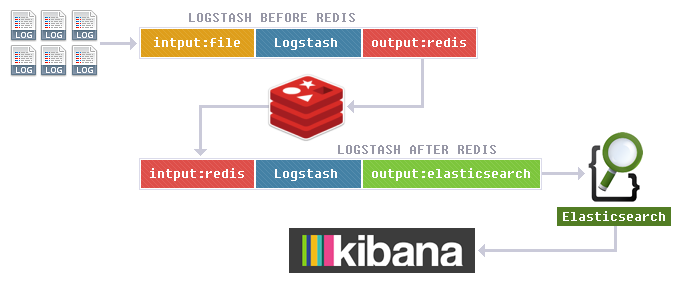
Via Redis
Configure Redis
请使用“Redis 3.x”版本,否则会有报错。
[root@redis-node1 ~]# yum install redis[root@redis-node1 ~]# vim /etc/redis.confbind 127.0.0.1 -> bind 172.16.1.24# Startup the service:[root@redis-node1 ~]# /etc/init.d/redis start
进行检测:
[root@ls-node1 ~]# redis-cli -h 172.16.1.24 -p 6379
Logstash before Redis
[root@ls-node1 ~]# vim /etc/logstash.confinput {file {path => "/var/log/messages"}}output {redis {data_type => "list"key => "system-messages"host => "172.16.1.24"port => "6379"}}
进行检测:
[root@ls-node1 ~]# redis-cli -h 172.16.1.24 -p 6379redis 172.16.1.24:6379> select 0OKredis 172.16.1.24:6379> keys *1) "system-messages"
Logstash after Redis
[root@redis-node1 ~]# vim /etc/logstash.confinput {redis {data_type => "list"key => "system-messages"host => "172.16.1.24"port => "6379"}}output {elasticsearch {hosts => "172.16.1.21"index => "system-messages-redis-%{+YYYY.MM.dd}"}}
如果产生的日志量非常的大,那么可以使用消息队列(例如RabbitMQ),也可使用“Kafka”。
Nginx-Logstash
Nginx
http {...log_format logstash_json '{"@timestamp":"$time_iso8601",''"host": "$server_addr",''"client": "$remote_addr",''"size": $body_bytes_sent,''"responsetime": $request_time,''"domain": "$host",''"url":"$uri",''"referer": "$http_referer",''"agent": "$http_user_agent",''"status":"$status"}';...}server {...access_log logs/access.json.log logstash_json;...}
查看日志文件内容:
[root@ls-node1 logs]# cat access.json.log{"@timestamp":"2016-06-20T10:37:02+08:00","host": "172.16.1.23","client": "172.16.1.1","size": 612,"responsetime": 0.000,"domain": "172.16.1.23","url":"/index.html","referer": "-","agent": "Mozilla/5.0 (Windows NT 6.1; WOW64; rv:47.0) Gecko/20100101 Firefox/47.0","status":"200"}...
Logstash before Redis
[root@ls-node1 ~]# vim /etc/logstash.confinput {file {path => "/usr/local/nginx/logs/access.json.log"codec => "json"}}output {redis {data_type => "list"key => "nginx-access-log"host => "172.16.1.24"port => "6379"db => "1"}}
Logstash after Redis
[root@redis-node1 ~]# vim /etc/logstash.confinput {redis {data_type => "list"key => "nginx-access-log"host => "172.16.1.24"port => "6379"db => "1"}}output {elasticsearch {hosts => "172.16.1.21"index => "nginx-access-log-%{+YYYY.MM.dd}"}}
