@flyboy1995
2016-11-14T15:39:39.000000Z
字数 1414
阅读 37
第八次作业
作业3.20
摘要
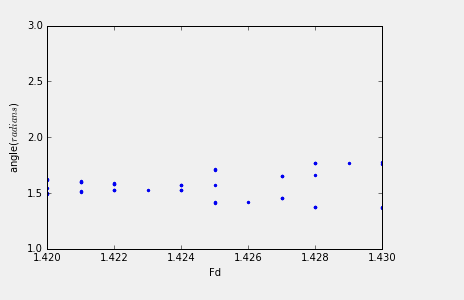
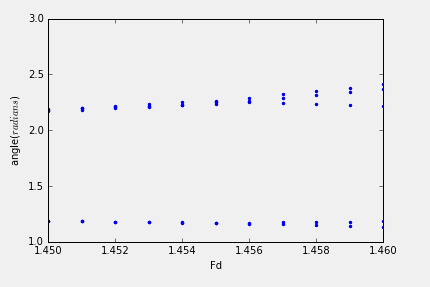
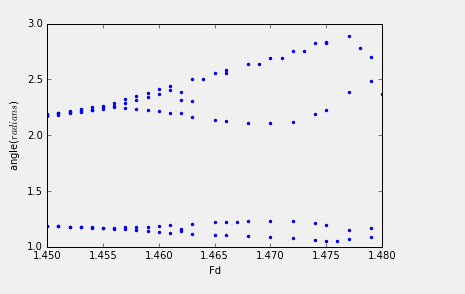
画出bifurcation图像,估算Feigenbaum系数。
背景
题目原文:
3.20:Calculate the bifurcation diagram for the pendulum in the vicinity of Fd=1.35 to 1.5. Make a magnified plot of the diagram and obtain an estimate oof the Feigenbaum parameter.
正文
import pylab as plimport mathclass chaotic_pendulums :def __init__(self,i=0,initial_theta=0.2,time_step=0.04,total_time=200.0,length=9.8,\g=9.8, initial_omega=0,q=0.5,Fd=1.35,omegaD=2.0/3.0,df=0.001):self.theta=[initial_theta]self.t=[0]self.omega=[initial_omega]self.dt=2*math.pi/1000.0*omegaDself.time=total_timeself.g=gself.l=lengthself.q=qself.omegaD=omegaDself.a=[0]self.b=[0]self.Fd=[Fd]self.dF=dfdef pendulums(self):while (self.Fd[-1]<=1.5):_time=0while(_time<self.time):self.omega.append(self.omega[-1]-((self.g/self.l)*math.sin(self.theta[-1])+\self.q*self.omega[-1]-self.Fd[-1]*math.sin(self.omegaD*self.t[-1]))*self.dt)self.theta.append(self.theta[-1]+self.omega[-1]*self.dt)self.t.append(_time)_time += self.dtif(self.theta[-1]>=math.pi):self.theta[-1]=self.theta[-1]-2*math.piif(self.theta[-1]<=-math.pi):self.theta[-1]=self.theta[-1]+2*math.piif(self.t[-1]%(2*math.pi/self.omegaD)<0.002 and self.t[-1]/(2*math.pi/self.omegaD)>15.0):self.b.append(self.theta[-1])self.Fd.append(self.Fd[-1])self.Fd[-1]+=self.dFdef show_result(self):pl.plot(self.Fd,self.b,'.')pl.xlabel('Fd')pl.ylabel('angle($radians$)')pl.xlim(1.35,1.50)pl.ylim(1.0,3.0)pl.show()a =chaotic_pendulums()a.pendulums()a.show_result()
结论


致谢
感谢秦大粤同学和徐秋豪同学。
