@HaomingJiang
2016-07-19T10:59:49.000000Z
字数 7033
阅读 3244
Tweets Analysis 2
Tweets Textmining
Feature Extraction
Vectorization
TF-IDF
Mean Accuarcy = 75.30%
Mean G-mean = 0.6739
TF
Mean Accuarcy = 73.30%
Mean G-mean = 0.6739
Occurrence
It is the base line method.
Mean Accuarcy = 76.24%
Mean G-mean = 0.6836
The result verify the idea in the last week report ("Word occurrence may matter more than word frequency.")
Classifier
Naive Bayes
It is the base line method.
Mean Accuarcy = 76.24%
Mean G-mean = 0.6836
Max-Entropy (without feature triming)
It's a popular classifier in text mining.
Mean Accuarcy = 75.14%
Mean G-mean = 0.6729
Performance Metric
- Confusion Matrix
- F1 Score (or F-score): A weighted average of precision and recall.
- G Measure: the geometric mean of recall values of all classes
- Kappa (or Cohen’s kappa): Classification accuracy normalized by the imbalance of the classes in the data.

- Precision: A measure of a classifiers exactness.
- Recall: A measure of a classifiers completeness

- ROC Curves & AUC: TP (sensitivity) can then be plotted against FP (1 – specificity) for each threshold used. The resulting graph is called a Receiver Operating Characteristic (ROC) curve (Figure 2). AUC (Area Under Curve) is a single scalar indicator.
Among them, AUC is a popular way to evaluate classifier. However, ROC is only designed for two classes. There is a generalized form of ROC is called ROC surface. Instead of AUC, VUS (Volumn under the ROC surface) is applied to evaluate the classifier.
# in the case of 3 classeslibrary(DiagTest3Grp)VUS(x, y, z)
MAUC, the average AUC of all pairs of classes, is another from of the extension of AUC.
library(pROC)multiclass.roc(...)
Summary: For simplicity, I use G-Measure and Accuarcy to evaluate the overall performance of the classifier.
Tactics To Combat Imbalanced Training Data
imbalanced class labels:
| negative | neutral | positive |
|---|---|---|
| 9082 | 3069 | 2334 |
Here I compare different sampling method to tackle with the imbalanced data: oversampling, undersampling, SMOTE
They are all used with Naive Bayes classifier and Binary(Occurence) Vectorization.
over-sampling
may suffer from ovefitting problems
rate=1.5
Confusion Matrix (for one run)
| prediction | negative | neutral | positive |
|---|---|---|---|
| negative | 526 | 73 | 34 |
| neutral | 37 | 130 | 32 |
| positive | 23 | 26 | 119 |
Statistical metrics for ten runs:
Accuarcy =
G-mean =
rate=2
Confusion Matrix (for one run)
| prediction | negative | neutral | positive |
|---|---|---|---|
| negative | 485 | 38 | 13 |
| neutral | 95 | 136 | 35 |
| positive | 53 | 35 | 123 |
Statistical metrics for ten runs:
Accuarcy =
G-mean =
rate=2.5
Confusion Matrix (for one run)
| prediction | negative | neutral | positive |
|---|---|---|---|
| negative | 469 | 26 | 11 |
| neutral | 103 | 141 | 36 |
| positive | 61 | 32 | 121 |
Statistical metrics for ten runs:
Accuarcy =
G-mean =
As the rate increased, the classifer is able to discern the minority class better, while it do harms to the majority one. I can be observed from the confusion matrix. Meanwhile, in this problem, the higher oversample rate does not mean the improvement of overall performance. It can be teel from the comparision of the deviation and the difference of the mean of performance metric. (Maybe it just because the class is not that imbalance)
under-sampling
rate=0.8
Confusion Matrix (for one run)
| prediction | negative | neutral | positive |
|---|---|---|---|
| negative | 508 | 36 | 17 |
| neutral | 85 | 130 | 28 |
| positive | 40 | 33 | 123 |
Statistical metrics for ten runs:
Accuarcy =
G-mean =
rate=0.6
Confusion Matrix (for one run)
| prediction | negative | neutral | positive |
|---|---|---|---|
| negative | 487 | 31 | 13 |
| neutral | 96 | 133 | 30 |
| positive | 50 | 35 | 125 |
Statistical metrics for ten runs:
Accuarcy =
G-mean =
rate=0.4
Confusion Matrix (for one run)
| prediction | negative | neutral | positive |
|---|---|---|---|
| negative | 457 | 23 | 10 |
| neutral | 117 | 141 | 31 |
| positive | 59 | 35 | 127 |
accuarcy(72.5%)
Apparently, the rate of 0.4 seriously damage the accuarcy.
Generate Synthetic Samples: SMOTE or the Synthetic Minority Over-sampling Technique. (In R, the DMwR package provides an implementation of SMOTE)
Setting: Use iris data to test the algorithm
data(iris)data <- iris[, c(1, 2, 5)]data <- data[c(1:20,51:75,101:150),]table(data$Species)# setosa versicolor virginica# 20 25 50newData <- SMOTE(Species ~ ., data, perc.over = 600,perc.under=100)table(newData$Species)# setosa versicolor virginica# 140 52 68cols=c('red','blue','green')plot(newData[, 1], newData[, 2], pch = 19 + as.integer(newData[,3]), main = "SMOTE'd Data",col=cols[as.integer(newData[,3])])
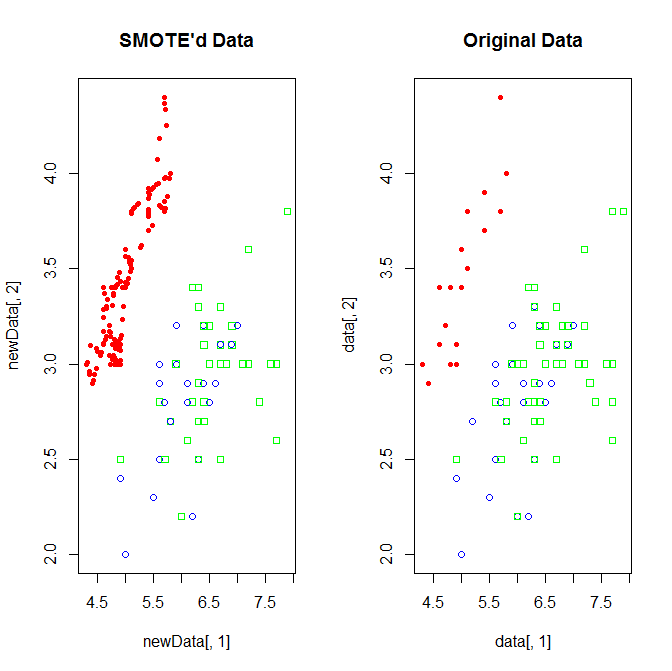
(The SMOTE in Muticlass Problem misbehaved: For the two minority classes, it only oversample the smaller one. Nevertheless, I still apply it to this text mining project. Because it is time costly, I only present one run result.)
| prediction | negative | neutral | positive |
|---|---|---|---|
| negative | 523 | 44 | 39 |
| neutral | 89 | 137 | 51 |
| positive | 21 | 18 | 78 |
Accuarcy: 73.8%
G-Mean:0.658
Intuitive Method (Stratified Method)
Inorder to balance the training data of predictor. I train two predictors. The first predictor is for discerning the majority class (negative) and other classes (neutral & positive). The amount of records in each class is (negative) and (neutral & positive)
After that, the second predictor is for discerning the remain two classes(neutral:, positive:).
(PS: I do not there exist class decdecomposition method, I will investigate them later.)
Confusion Matrix (for one run)
| prediction | negative | neutral | positive |
|---|---|---|---|
| negative | 525 | 47 | 15 |
| neutral | 72 | 119 | 30 |
| positive | 36 | 33 | 123 |
Statistical metrics for ten runs:
Accuarcy =
G-mean =
Conclusion:
The Oversampling improve the classifier overall performance the most. Meanwhile undersampling do harms to the performance. SMOTE's behavior is strange, it may not be directly applied to muticlass case. Stratified Method's performance is similar to the baseline method.
From the view of confusion matrix, Oversampling and Undersampling tend to classify the record to the minority class, regardless which class it originally belongs to. Which also means it do harm to the majority class prediction. Compared to them, SMOTE do not do harm to the prediction of majority class. However, if we want to apply SMOTE, we must overcome the barriers of muticlass.
Basic Line
Occurrence & Naive Bayes
training set: 13485
test set: 1000
(they are selected reandomly. For each run of algorithm, the random seed is reset to a different value.)
Confusion Matrix (for one run)
| prediction | negative | neutral | positive |
|---|---|---|---|
| negative | 518 | 40 | 22 |
| neutral | 77 | 126 | 27 |
| positive | 38 | 33 | 119 |
Statistical metrics for ten runs:
Accuarcy =
G-mean =
Problems & Discussion:
- I don't know how to use MAUC or VUS to evaluate the classifier, since in the implementation of R the input is different from the output of the Bayesian Classifier.
- How to extand SMOTE to muticlass case?
- Muticlass class is a challange in both evaluation and other tactics.
- I will try more advanced tactics in the next week, including aggregate method. Also I will review the feature extraction process, because I think that tactics are not as effective as I expect.
Reference
http://machinelearningmastery.com/assessing-comparing-classifier-performance-roc-curves-2/
https://www.quora.com/In-classification-how-do-you-handle-an-unbalanced-training-set
Gustavo E. A. P. A. Batista, Ronaldo C. Prati, and Maria Carolina Monard. 2004. A study of the behavior of several methods for balancing machine learning training data. SIGKDD Explor. Newsl. 6, 1 (June 2004), 20-29. DOI=http://dx.doi.org/10.1145/1007730.1007735
David J. Hand and Robert J. Till (2001). A Simple Generalisation of the Area Under the ROC Curve for Multiple Class Classification Problems. Machine Learning 45(2), p. 171--186. DOI: http://dx.doi.org/10.1023/A:101092081983110.1023/A:1010920819831.
Chawla, N. V., Bowyer, K. W., Hall, L. O., and Kegelmeyer, W. P. (2002). Smote: Synthetic minority over-sampling technique. Journal of Artificial Intelligence Research, 16:321-357.
