@HaomingJiang
2016-08-14T21:20:30.000000Z
字数 4559
阅读 4208
Chp9 Cluster Analysis: Advanced Concepts and Algorithms
数据挖掘导论 笔记
9.1 Based on prototype
Extensions:
1. each record can belong to different cluster
2. using statistical distribution to build the model
3. connection restricting clusters
9.1.1 Fuzzy clustering
Fuzzy c-means
The difference from k-means: each record has a weighted vector corresponding to different cluster.
9.1.2 Mixture Model
It is something like GMM
Use EM to approximate MLE.
The process of EM is similar to K-means, which is a special case of UGMM.
1. randomly initalize the parameters.
2. reassign nodes to each cluster.
3. calculate new parameters.
Pro: more greneral, simplify data, easy to describe the clusters
Con: slow, cant handle linear data, hard to choose model(can be tackled with Bayes Method), noise and outlier
9.1.3 SOM
Self Organizing Maps (SOM) is a neural network with a input and a hidden layer.
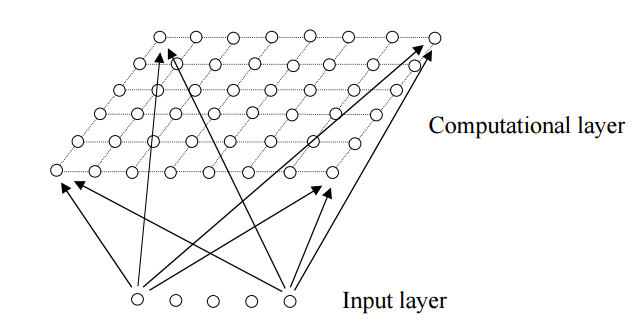
each node in computational layer is a vector.
1. initialization. Can use vectors from dataset
2. for each input, find a nearest node
3. update: use gradient descend. for each node , nee , topodist is the topology distance in computational layer, which is not .
different topology relation can be apply (e.g. triangle, hexagon)
GOOD VISULIZATION.
9.2 Based on density
9.2.1 Grid Based
- define grid
- assign records to units, and count the desity for each unit
- delete sparse unit. or filter with some careful consideration
- cluster near unit
Highly rely on desity threshold
9.2.2 Subspace Based
Using feature subspace.
It can use a subset of feature to cluster data.
- CLIQUE
If a cluster form in k-dimension space. It is still a cluster in any sub (k-1)-D space of k-D space.
a. find dense units in each 1-D space.
b. repeat:
c. use every (k-1)-D dense unit generate dense k-D unit
d. filter these units.
It seems like Apriori.
- DENCLUE (DENsity CLUstEring)
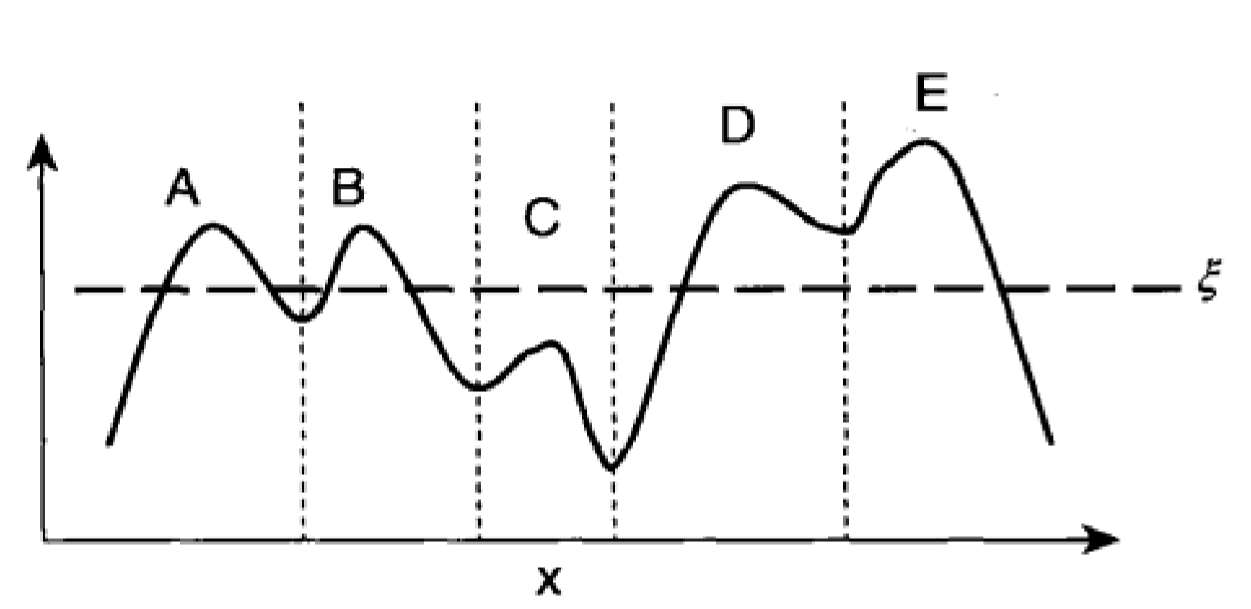
a. esitimate the density function (kernal density estimation, can use grid based method to confine the amount of nodes)
b. identify local density attractor
c. Find out the ascending direction of each node, and assign them to each attractor.
d. define each cluster
e. filter the spare cluster
f. integrate clusters which is linked by a dense path
Need large computational resource
9.3 Based on graph
9.3.1 KNN Graph
- reduce the data set
- Better cluster
- Graph Partition Algorithm
It is a initialization step.
9.3.2 Minimum Spanning Tree (MST)
- generate the MST
- repeat: cut the largest edge.
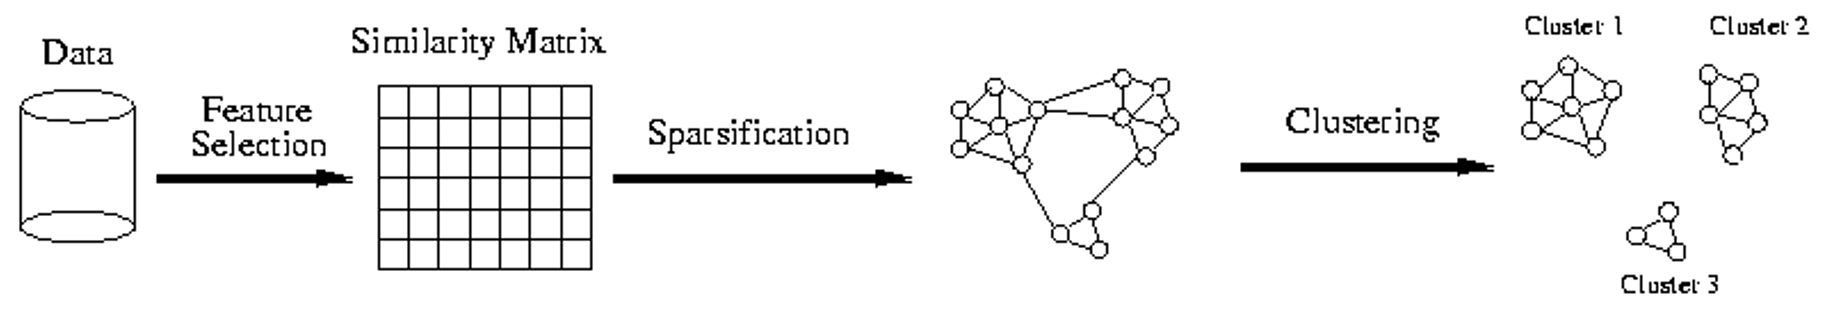
9.3.3 OPOSSUM(Optimal Partitioning of Sparse Similarity Using METIS)
It is designed for sparse data, e.g. document.
- generate sparse similarity graph
- use METIS (minimize weight between banches; balance restriction) to divide the graph into different cluster
fast and simple; divide data in similar size groups.
It is be taken as first step of Chameleon.
9.3.4 Chameleon
Main property is the relative closeness and relative interconnectivity of the cluster
Two clusters are combined if the resulting cluster shares certain properties with the constituent clusters
The merging scheme preserves self-similarity
Relative Closeness, RC desribes the absolute similarity between 2 clusters regulared with each cluster's self-similarity. It help preserves self-similarity
kNN graph's average weight
Relative Interconnectivity, RI
is the sum of edges
self-similarity can be the combination of RI and RC
Chameleon:
1. construct KNN graph
2. Use a multilevel graph partitioning algorithm on the graph to find a large number of clusters of well-connected vertices (e.g. METIS)
3. repeat: merge the group which preserves the self-similarity the best.
9.3.5 Shared Near Neighbor Approach, SNN
- find all k-neighbor
- if x&y are not neighbor: similarity(x,y)=0
- else: similarity(x,y)=common neighbor
The generated graph called SNN similarity graph, which is sparse.
It is adaptive to the density.
9.3.6 Jarvis-Patrick, JP
- construct SNN similarity graph
- Sparsify the SNNsimilarity matrix.
- Find the connected component
Pro: good at dealing with noise and outlier and clusters with different size,density and shapes and also high-demension
Con: not all record will be clustered. it's is too brittle
9.3.7 SNN desity
similarly, we can use cluastering based on SNN density.
9.4 Extensible Method
Spatial tactics: k-d tree, use triangle inequality to simplify the distance calculation (i.e. by using distance from the point to the current centre, and distances between centers, we can estimate the distance from the point to other centres)
Sampling method, only cluster a sample.
Devide the graph into different eperated groups.
Parallel Computing.
9.4.1 BIRCH
- constrcut CF tree, which is balanced (each leaf node is a cluster) 2.
