@zhangsiming65965
2019-09-29T12:38:24.000000Z
字数 2757
阅读 292
如何接入promethues+grafana
监控服务系列
---Author:张思明 ZhangSiming
---Mail:siming_zhang@shannonai.com
---QQ:1030728296
1.克隆promethues-operator测试代码
2.使用测试promethues-operator代码
使用环境: k8s测试集群,如果不知道怎么使用,请点我
使用方法:
$ cat values.yaml | tail -58#ADD new service to monitorADD_monitor:serviceMonitor1:enabled: trueserivename: testserviceportname: testservicemetricpath: /metricservicenamespace: testserviceMonitor2:enabled: falseserivename:serviceportname:servicemetricpath:servicenamespace:serviceMonitor3:enabled: falseserivename:serviceportname:servicemetricpath:servicenamespace:serviceMonitor4:enabled: falseserivename:serviceportname:servicemetricpath:servicenamespace:#Current only support add servicemonitor max to 4, if you want more, @zhangsiming#Usage#enabled: Whether to create a addon servicemonitor#serivename: your service's name#serviceportname: your service's port name#servicemetricpath: your service's metric port#servicenamespace: you service in what namespace#KEY POINT!!!#your service must have a label: "k8s-app: ${serivename}"#FOR EXAMPLE:#**************************************************#* YOUR SERVICE NEED TO BE SOMETHING LIKE THIS: *#* apiVersion: v1 *#* kind: Service *#* metadata: *#* labels: *#* k8s-app: testservice *#* name: testservice *#* namespace: test *#* spec: *#* ports: *#* - name: testport *#* port: 8000 *#* protocol: TCP *#* targetPort: 8000 *#* selector: *#* ...match you pod... *#* type: ClusterIP *#* *#**************************************************
配置:
| 字段 | 含义 |
|---|---|
| enabled | 是否启用servicemonitor |
| serivename | 需要监控的服务的名称 |
| serviceportname | 需要监控的服务的端口名称 |
| servicemetricpath | 需要监控的服务的路径,一般"/"即可 |
| servicenamespace | 需要监控的服务所在的命名空间 |
修改chart上述的配置,进行部署即可。
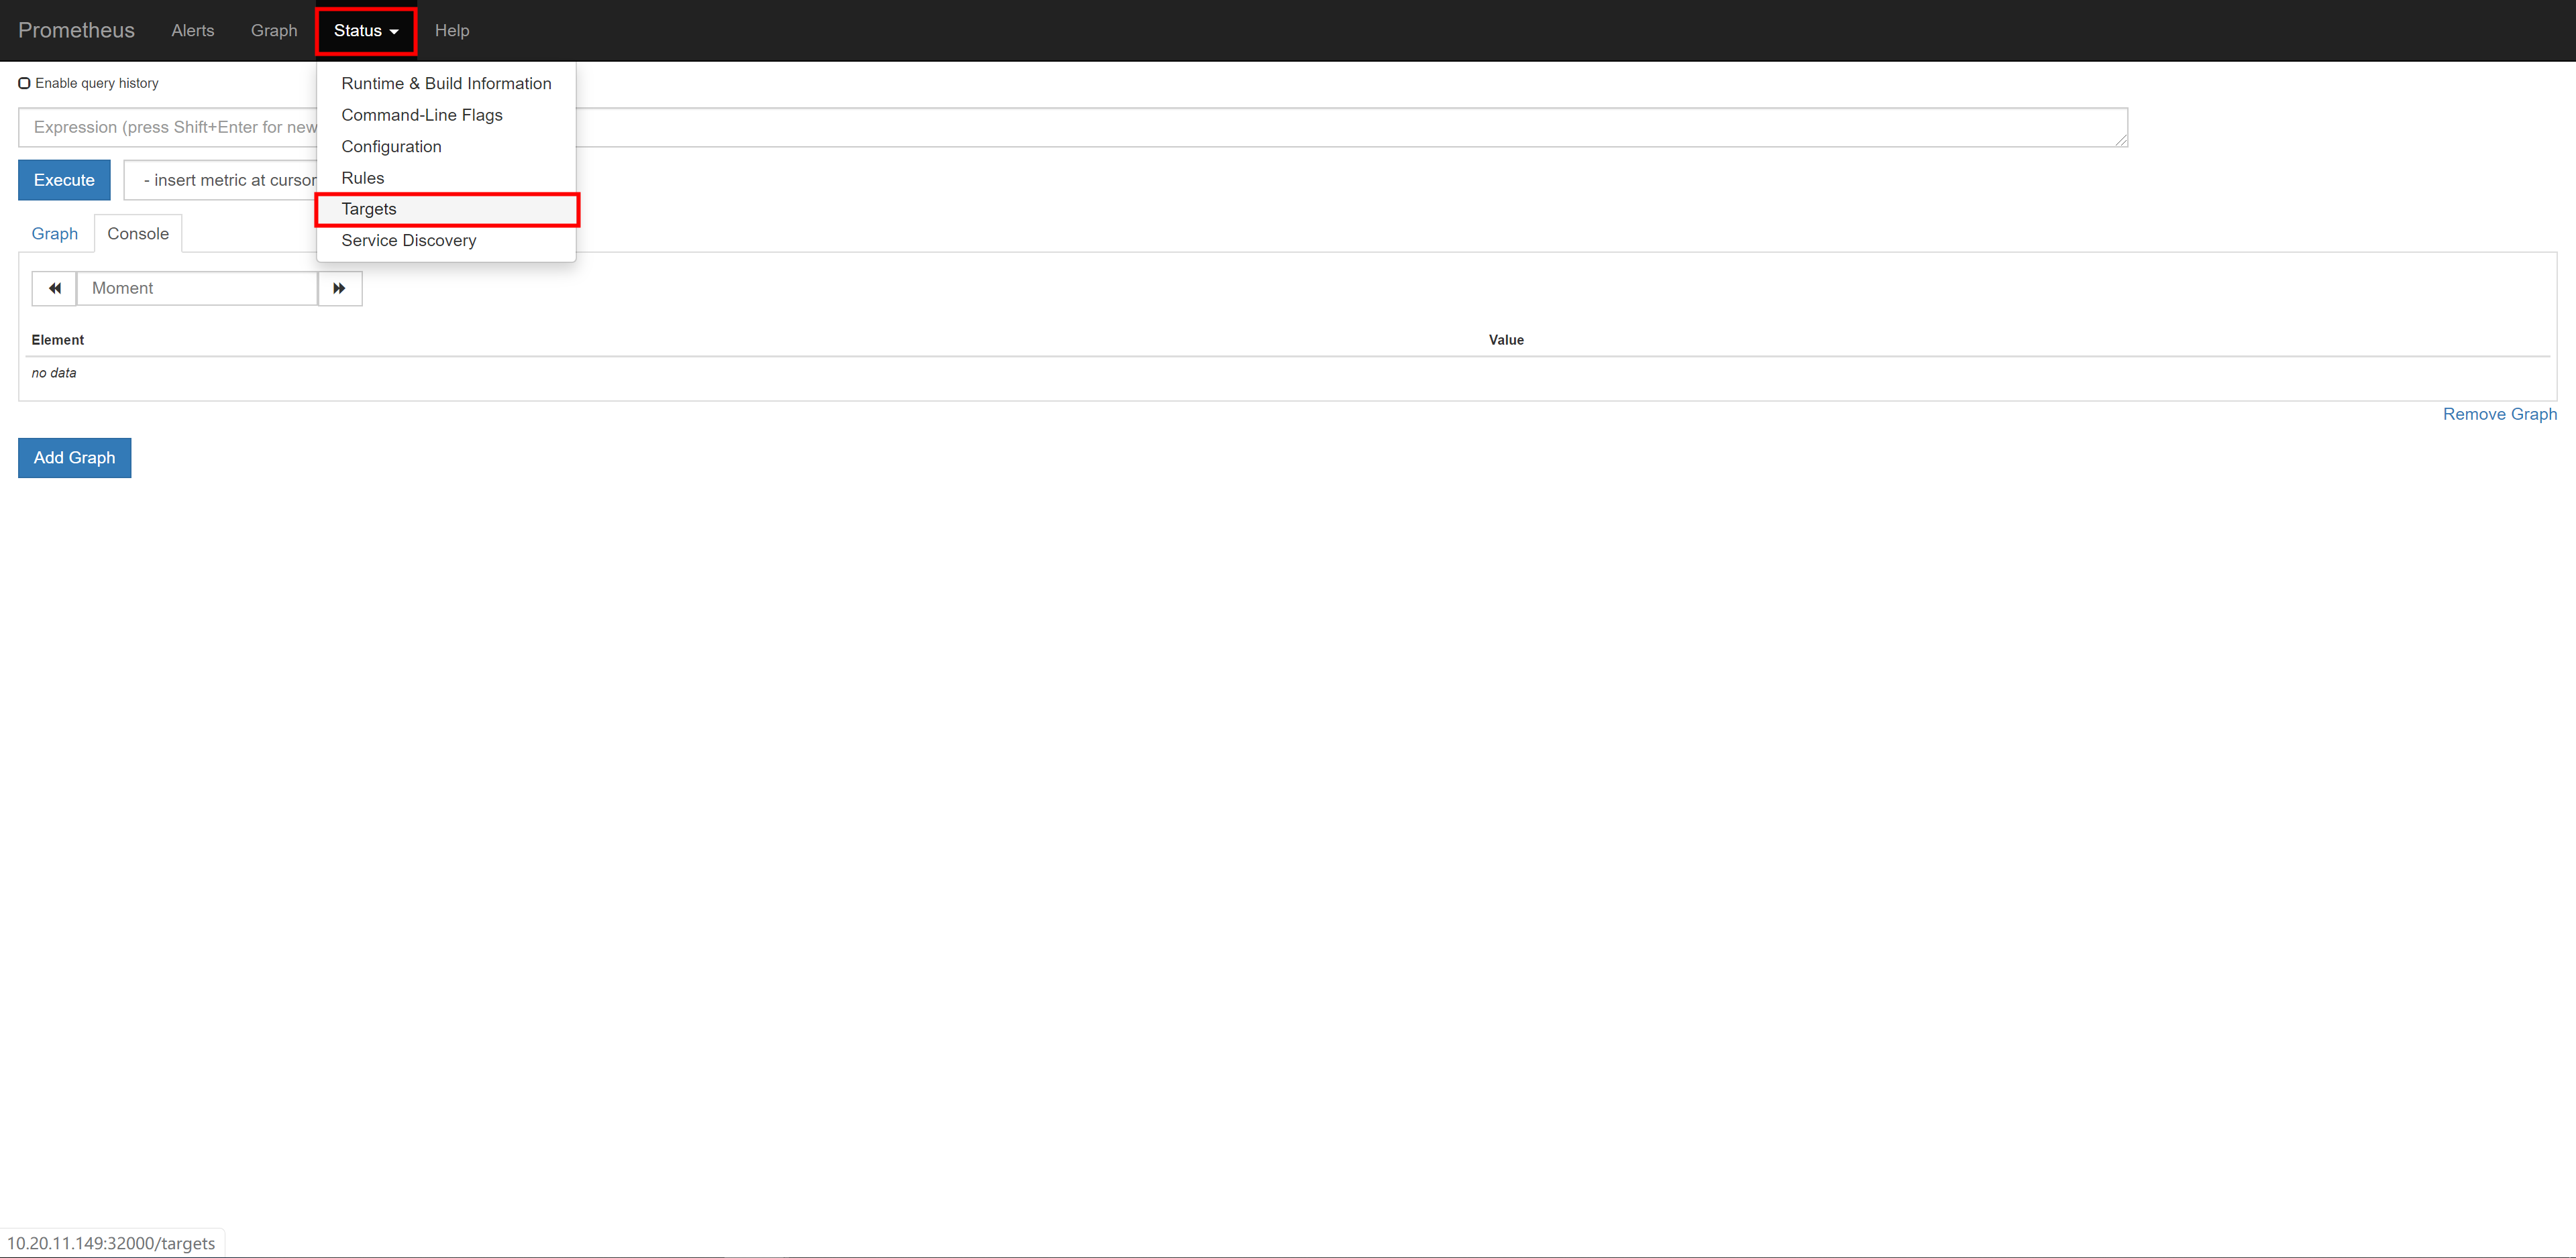
3.如何查看是否抓到Metric
$ kubectl get svc -n testprometheus-operator-nx-grafana NodePort 172.60.79.245 <none> 80:20102/TCP 26mprometheus-operator-nx-prometheus NodePort 172.60.217.193 <none> 9090:32000/TCP 26m
使用:http://10.20.11.149:32000访问promethues
使用:http://10.20.11.149:20102访问grafana
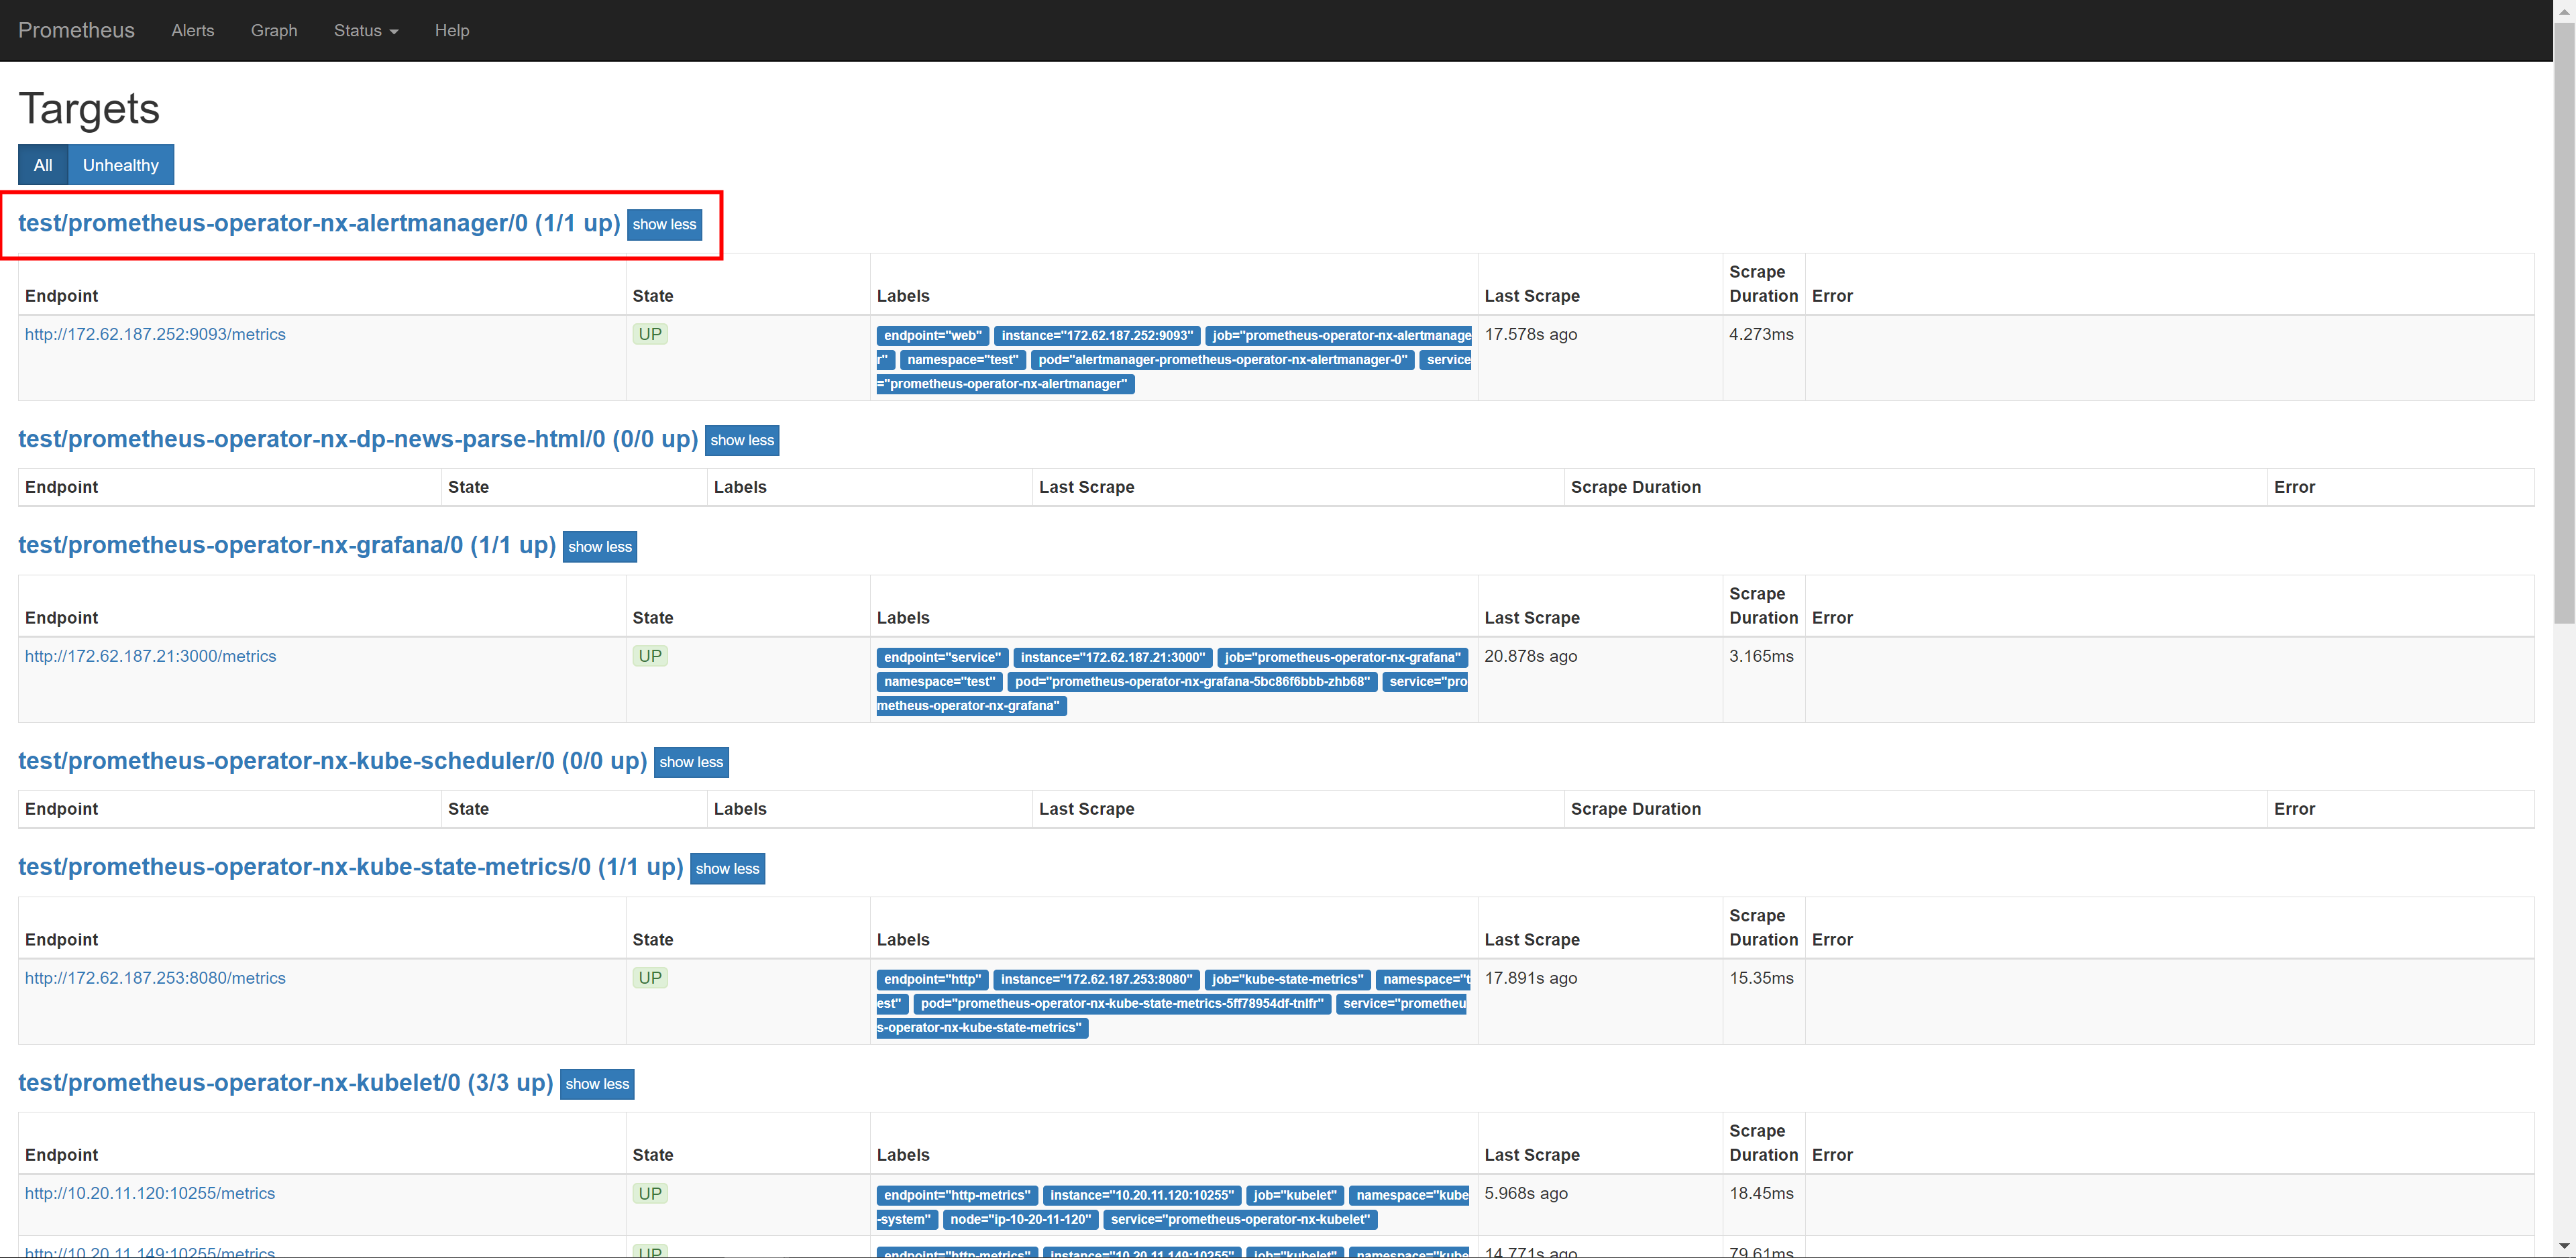
- promethues正常情况下显示
解释:
1.0/0:表示servicemonitor已经正常启动但是没有找到对应的service,考虑service是否存在已经标签是否可以被servicemonitor选中;
2.0/1:表示servicemonitor可以匹配到service,但是在指定的端口及路径获取不到metric;
3.1/1:表示正常,可以抓出指标,之后可以去配置grafana;
4.未显示:表示servicemonitor没有生效,考虑servicem的标签是否正常
#在集群内访问,target的metric地址+端口可以看到获取的暴露的指标$ curl http://172.62.23.12:8000/# HELP python_gc_objects_collected_total Objects collected during gc# TYPE python_gc_objects_collected_total counterpython_gc_objects_collected_total{generation="0"} 45438.0python_gc_objects_collected_total{generation="1"} 9877.0python_gc_objects_collected_total{generation="2"} 38.0# HELP python_gc_objects_uncollectable_total Uncollectable object found during GC# TYPE python_gc_objects_uncollectable_total counterpython_gc_objects_uncollectable_total{generation="0"} 0.0python_gc_objects_uncollectable_total{generation="1"} 0.0python_gc_objects_uncollectable_total{generation="2"} 0.0
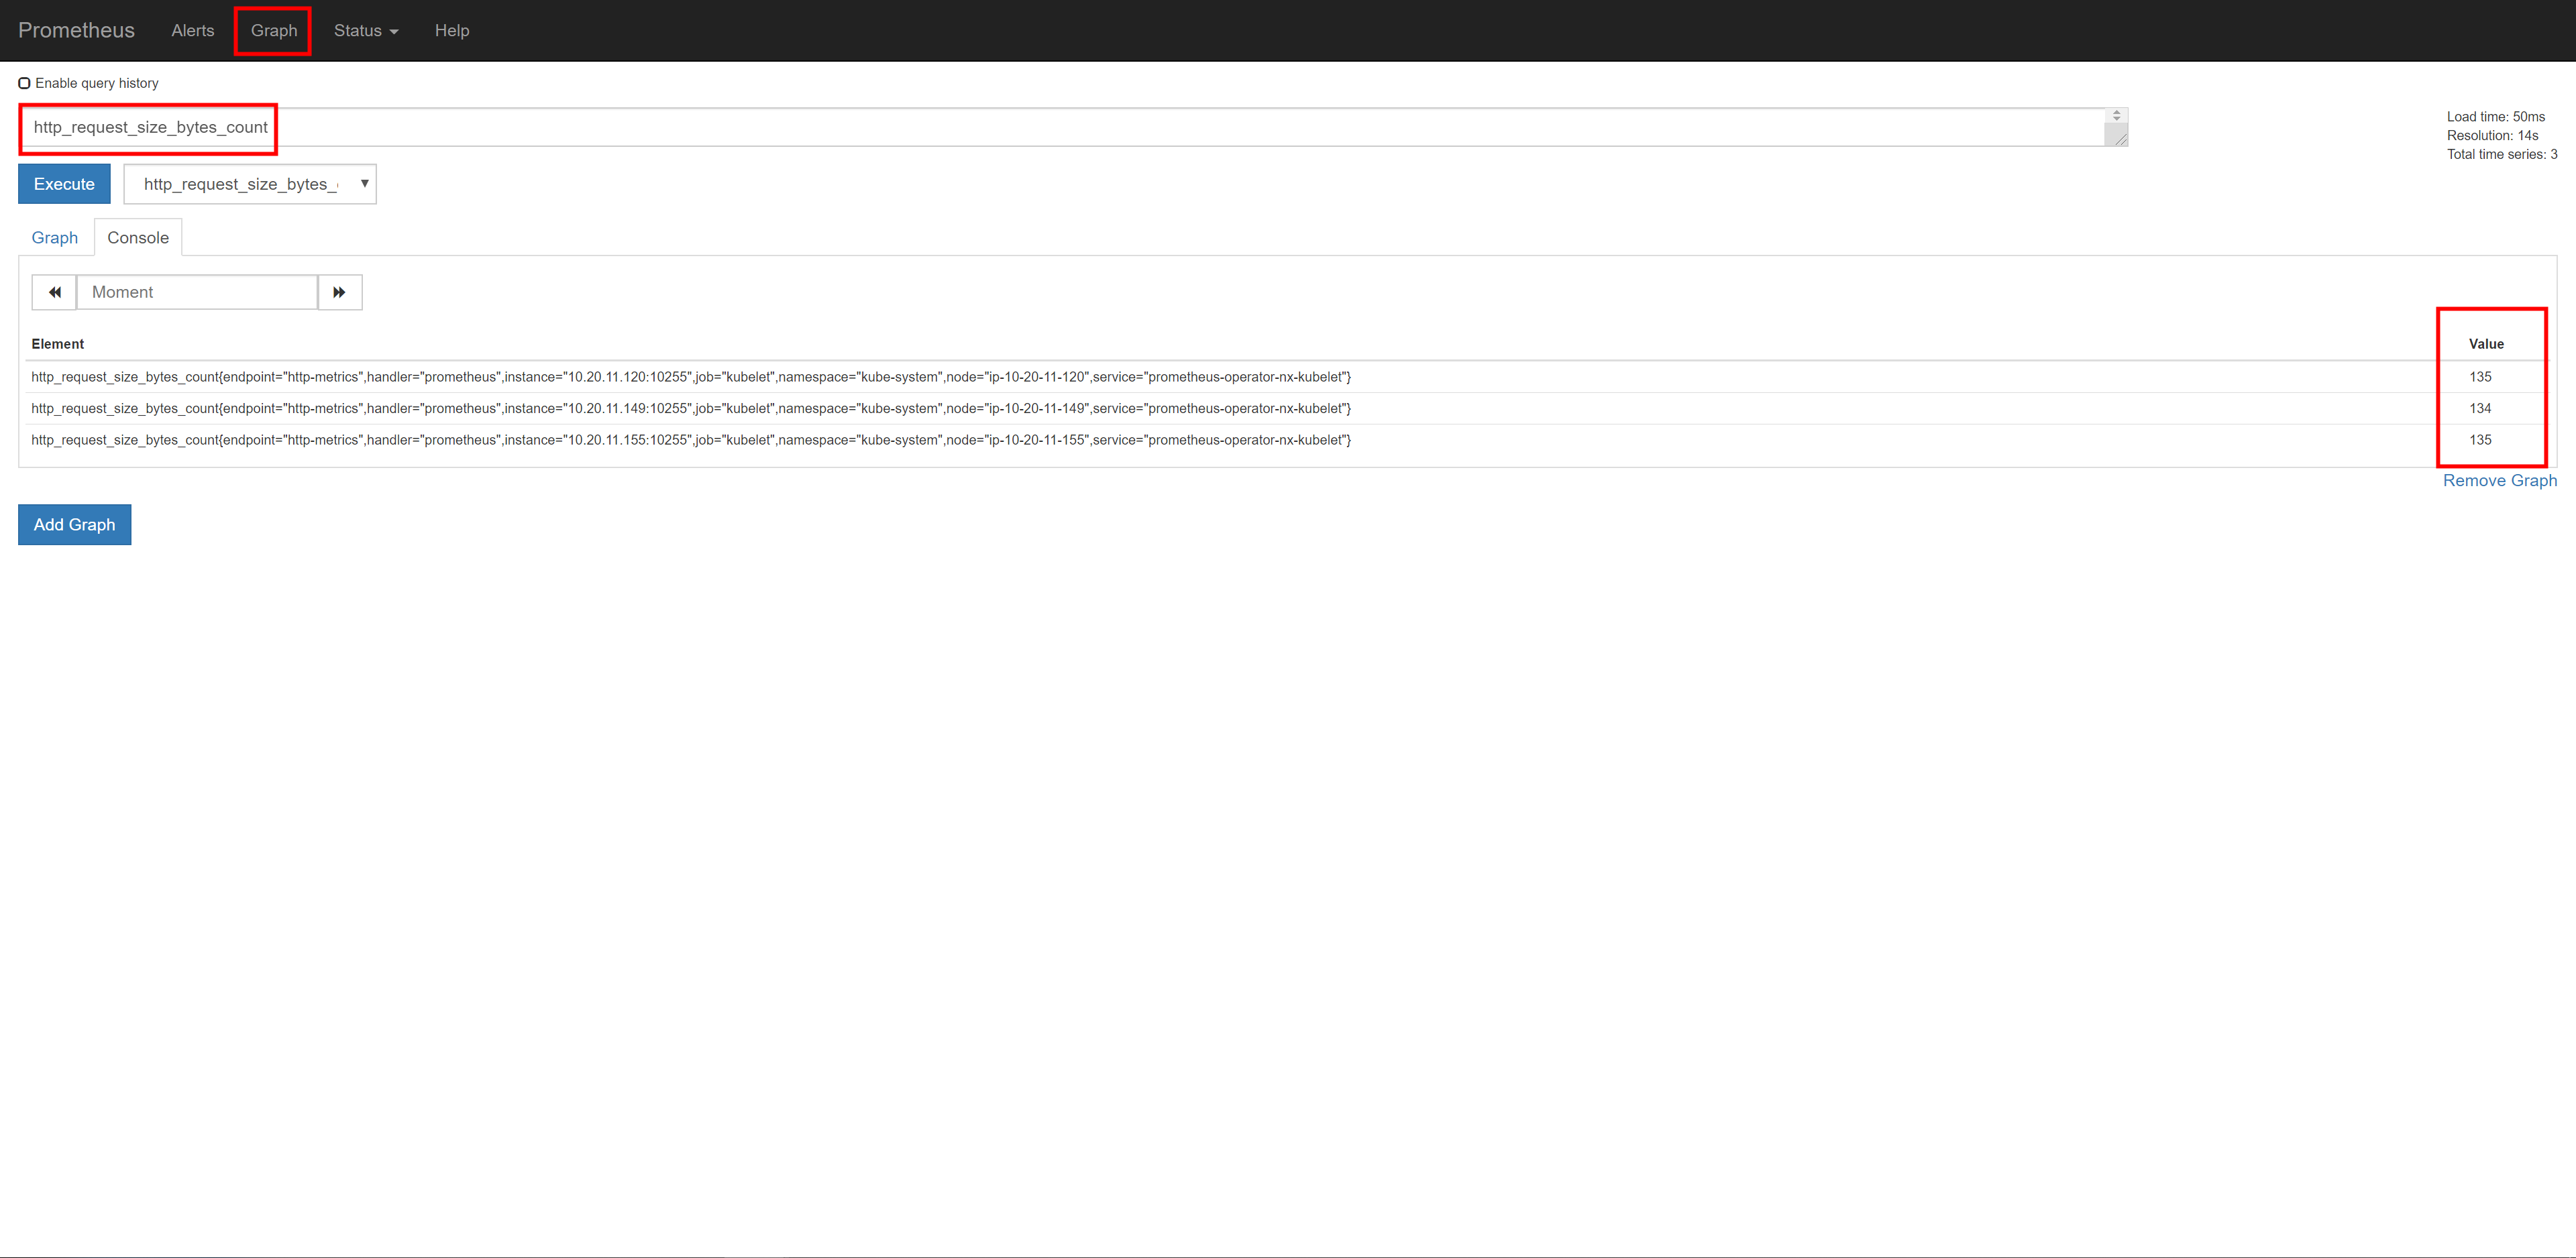
可以在promethues上过滤一下抓到的值,之后就可以前往grafana进行dashboard的配置(admin);
