@Mr-13
2018-10-18T08:41:08.000000Z
字数 9227
阅读 240
短信平台重启服务器 - 服务恢复手册
未来无线
需要关心的核心服务:
- Orcle
- tomcat (web服务)
- SMS四大服务:smsserver、smsprocess、smsclient、smsbatsave
- Redis
- Memcache
服务器重启之后的服务回复顺序
一、启动Oracle
1. 登入oracle账户
[root@localhost ~]# su - oracle
2. 进入sqlplus
# 切入sql[oracle@localhost ~]$ sqlplus / as sysdba;SQL*Plus: Release 11.2.0.1.0 Production on Wed Apr 11 15:03:38 2018Copyright (c) 1982, 2009, Oracle. All rights reserved.Connected to an idle instance.SQL>
3. 启动数据库
# 启动SQL> startup;ORACLE instance started.Total System Global Area 2.6991E+10 bytesFixed Size 2213976 bytesVariable Size 1.9596E+10 bytesDatabase Buffers 7247757312 bytesRedo Buffers 145174528 bytesDatabase mounted.Database opened.SQL># 退出sqlSQL> exitDisconnected from Oracle Database 11g Enterprise Edition Release 11.2.0.1.0 - 64bit ProductionWith the Partitioning, OLAP, Data Mining and Real Application Testing options
4. 查看数据库侦听状态
# 查看侦听状态[oracle@localhost ~]$ lsnrctl statusLSNRCTL for Linux: Version 11.2.0.1.0 - Production on 11-APR-2018 15:04:11Copyright (c) 1991, 2009, Oracle. All rights reserved.Connecting to (DESCRIPTION=(ADDRESS=(PROTOCOL=TCP)(HOST=localhost)(PORT=1521)))TNS-12541: TNS:no listenerTNS-12560: TNS:protocol adapter errorTNS-00511: No listenerLinux Error: 111: Connection refused
5. 启动数据库侦听
# 启动数据库侦听[oracle@localhost ~]$ lsnrctl startLSNRCTL for Linux: Version 11.2.0.1.0 - Production on 11-APR-2018 15:04:17Copyright (c) 1991, 2009, Oracle. All rights reserved.Starting /home/app/oracle/product/11.2.0/dbhome_1/bin/tnslsnr: please wait...TNSLSNR for Linux: Version 11.2.0.1.0 - ProductionSystem parameter file is /home/app/oracle/product/11.2.0/dbhome_1/network/admin/listener.oraLog messages written to /home/app/oracle/diag/tnslsnr/localhost/listener/alert/log.xmlListening on: (DESCRIPTION=(ADDRESS=(PROTOCOL=tcp)(HOST=localhost)(PORT=1521)))Connecting to (DESCRIPTION=(ADDRESS=(PROTOCOL=TCP)(HOST=localhost)(PORT=1521)))STATUS of the LISTENER------------------------Alias LISTENERVersion TNSLSNR for Linux: Version 11.2.0.1.0 - ProductionStart Date 11-APR-2018 15:04:17Uptime 0 days 0 hr. 0 min. 0 secTrace Level offSecurity ON: Local OS AuthenticationSNMP OFFListener Parameter File /home/app/oracle/product/11.2.0/dbhome_1/network/admin/listener.oraListener Log File /home/app/oracle/diag/tnslsnr/localhost/listener/alert/log.xmlListening Endpoints Summary...(DESCRIPTION=(ADDRESS=(PROTOCOL=tcp)(HOST=localhost)(PORT=1521)))The listener supports no servicesThe command completed successfully# 数据库侦听启动成功# 数据库启动完成,退出oracle账户[oracle@localhost ~]$ exitlogout
- 启动数据库侦听需要注意:
lsnrctl start之后注意查看打印内容,主要是侦听的HOST,重启服务器之后,主机名可能会变,这时候侦听会出错,导致smsserver、客户端查询工具等无法连接到数据库,服务不可用,同时服务(smsserver等)会不断打印出异常日志。
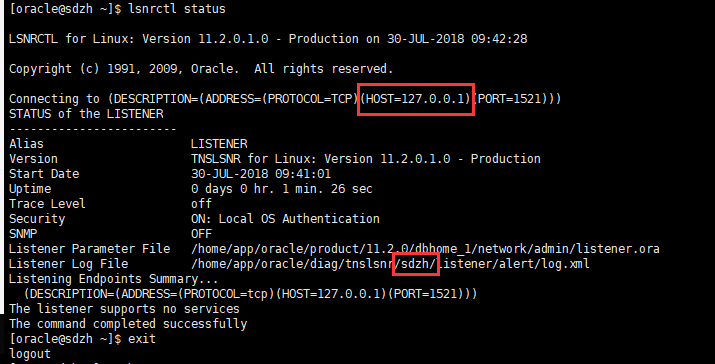
如上图,这是重启后的异常状态,此时HOST=127.0.0.1,当前主机名是localhost;但是从侦听日志文件记录可以看出,正常情况下,原主机名应该是sdzh这时,启动smsserver会一直报错,无法连接到数据库。
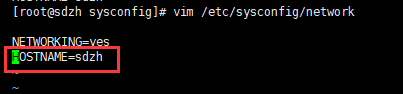
设置/恢复主机名
# 查看当前主机名[root@sdzh ~]# hostname# 编辑主机名[root@sdzh ~]# vim /etc/sysconfig/network# 编辑保存退出后,重启服务器生效[root@sdzh ~]# reboot
检查oracle的ora文件设置
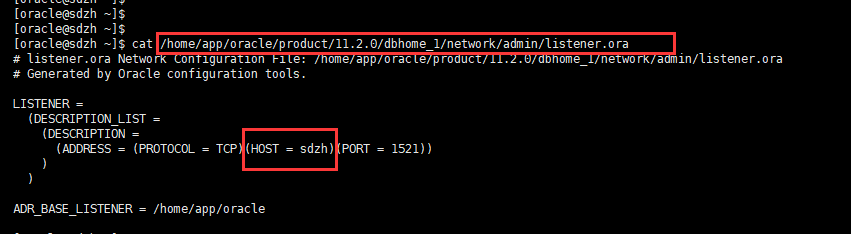
如上图,ora文件中的HOST对应主机名应保持一致。
二、启动tomcat
1. 登入smsplatform账户
# 登入 smsplatform 账户[root@localhost ~]# su smsplatform
2. 启动tomcat
# 进入tomcat目录[smsplatform@localhost root]$ cd ~[smsplatform@localhost ~]$ lsapache-tomcat-7.0.47 app backup webapps[smsplatform@localhost ~]$ cd apache-tomcat-7.0.47/bin/# 启动tomcat[smsplatform@localhost bin]$ ./startup.shUsing CATALINA_BASE: /home/smsplatform/apache-tomcat-7.0.47Using CATALINA_HOME: /home/smsplatform/apache-tomcat-7.0.47Using CATALINA_TMPDIR: /home/smsplatform/apache-tomcat-7.0.47/tempUsing JRE_HOME: /usr/java/jdk1.8.0_45/jreUsing CLASSPATH: /home/smsplatform/apache-tomcat-7.0.47/bin/bootstrap.jar:/home/smsplatform/apache-tomcat-7.0.47/bin/tomcat-juli.jar# tomcat启动完成,这时候打开浏览器,访问站点可以正常打开平台就OK
三、 启动sms四大服务
1. 登入smsplatform账户
# 登入 smsplatform 账户[root@localhost ~]# su smsplatform
2. 启动服务
# 启动smsserver服务[smsplatform@localhost ~]$ cd app/smsserver/bin/[smsplatform@localhost bin]$ ./smsserver.sh startstarting ......started# 启动smsclient服务[smsplatform@localhost bin]$ cd ~/app/smsclient/bin/[smsplatform@localhost bin]$ lssmsclient.sh[smsplatform@localhost bin]$ ./smsclient.sh start 1 5starting ......starting 1.........starting 2.........starting 3.........starting 4.........starting 5.........started# 启动smsprocess服务[smsplatform@localhost ~]$ cd app/smsprocess/bin/[smsplatform@localhost bin]$ lssmsprocess.sh[smsplatform@localhost bin]$ ./smsprocess.sh startstarting ...............started# 启动smsbatsave服务[smsplatform@localhost bin]$ cd ~/app/smsbatsave/bin/[smsplatform@localhost bin]$ lssmsbatsave.sh[smsplatform@localhost bin]$ ./smsbatsave.sh startstarting ...............started
注意事项:
如果是重启服务时,在执行重启动作,例如:smsserver stop之前,一定要先确认该服务(这里是smsserver)当前是都已经完全关闭,方法:
[smsplatform@localhost bin]$ ps -ef | grep smsserver //这里写需要查看的服务名称
如果,当前服务进程仍然存在,需要先杀死原有进程之后,再执行启动命令,否则会导致主服务进程状态异常:
[smsplatform@localhost bin]$ kill -9 进程IP //这里写刚才ps -ef查到的进程ID[smsplatform@localhost bin]$ cd ~/app/smsserver/bin[smsplatform@localhost bin]$ ./smsserver.sh start
四、检查服务状态
- 检查服务进程:oracle、tomcat、sms四项服务进程
- 检查服务端口状态
1. 检查服务状态
检查各项服务是否正常,以tomcat为例
# 使用ps -ef检查服务,使用grep + 服务名,查找具体进程# 如果检查目标服务有具体进程就OK[smsplatform@localhost bin]$ ps -ef | grep tomcat501 4365 1 0 15:04 pts/1 00:00:00 /bin/sh /home/smsplatform/apache-tomcat-7.0.47/bin/catalina.sh start501 4366 4365 99 15:04 pts/1 00:02:11 /usr/java/jdk1.8.0_.......tartup.Bootstrap start501 5432 4342 0 15:06 pts/1 00:00:00 grep tomcat# 其他服务进程检查同上
2. 检查服务端口
[smsplatform@localhost bin]$ netstat -tunpl(Not all processes could be identified, non-owned process infowill not be shown, you would have to be root to see it all.)Active Internet connections (only servers)Proto Recv-Q Send-Q Local Address Foreign Address State PID/Program nametcp 0 0 0.0.0.0:5003 0.0.0.0:* LISTEN 4609/javatcp 0 0 127.0.0.1:11211 0.0.0.0:* LISTEN -tcp 0 0 127.0.0.1:6379 0.0.0.0:* LISTEN -tcp 0 0 0.0.0.0:8588 0.0.0.0:* LISTEN 4771/javatcp 0 0 0.0.0.0:8012 0.0.0.0:* LISTEN 4366/javatcp 0 0 0.0.0.0:111 0.0.0.0:* LISTEN -tcp 0 0 0.0.0.0:8080 0.0.0.0:* LISTEN 4366/javatcp 0 0 0.0.0.0:6001 0.0.0.0:* LISTEN 4771/javatcp 0 0 0.0.0.0:1521 0.0.0.0:* LISTEN -tcp 0 0 0.0.0.0:6002 0.0.0.0:* LISTEN 4823/javatcp 0 0 0.0.0.0:6003 0.0.0.0:* LISTEN 4878/java..........udp 0 0 0.0.0.0:631 0.0.0.0:* -udp 0 0 127.0.0.1:51578 0.0.0.0:* -udp 0 0 127.0.0.1:32895 0.0.0.0:* -udp 0 0 127.0.0.1:46224 0.0.0.0:* -udp 0 0 0.0.0.0:657 0.0.0.0:* -udp 0 0 0.0.0.0:935 0.0.0.0:* -udp 0 0 0.0.0.0:64316 0.0.0.0:* -udp 0 0 127.0.0.1:11211 0.0.0.0:* -udp 0 0 0.0.0.0:26729 0.0.0.0:* -udp 0 0 :::111 :::* -udp 0 0 :::935 :::* -udp 0 0 :::56631 :::* -
3. 检查sms四大服务日志输出是否正常
[smsplatform@localhost bin]$ cd ~/app/smsclient/runlogs/[smsplatform@localhost runlogs]$ tail -f runlogs_1.log[15:05:36:432] -l??t??192.168.125.55:88553?? ′х?£oFailed to get the session.[15:05:51:444] -l??t??192.168.125.55:88553?? ′х?£oFailed to get the session.[15:05:55:523] -l??t??192.168.125.55:88593?? ′х?£oFailed to get the session.[15:06:06:457] -l??t??192.168.125.55:88553?? ′х?£oFailed to get the session.[15:06:15:534] -l??t??192.168.125.55:88593?? ′х?£oFailed to get the session.[15:06:21:506] -l??t??192.168.125.55:88553?? ′х?£oFailed to get the session.[15:06:35:564] -l??t??192.168.125.55:88593?? ′х?£oFailed to get the session.[15:06:36:518] -l??t??192.168.125.55:88553?? ′х?£oFailed to get the session.[15:06:51:530] -l??t??192.168.125.55:88553?? ′х?£oFailed to get the session.[15:06:55:577] -l??t??192.168.125.55:88593?? ′х?£oFailed to get the session.[15:07:06:565] -l??t??192.168.125.55:88553?? ′х?£oFailed to get the session.^C[smsplatform@localhost runlogs]$ tail -f runlogs_2.log[15:05:27:366] -??ˉ-2?±?????μ5??CMPP20·t??127.0.0.1:88553?|£? SessionId:3[15:05:27:366] -??ˉ??§????¢???????[15:05:27:367] -??ˉ?·¢??????[15:05:28:314] -??ˉθ1??¤П3??[15:05:57:397] -l???г?1??±??????ˉ·¢?ф?°??an_id:661[15:05:57:401] -?μ?ф???′°??n_id:661[15:06:27:433] -l???г?1??±??????ˉ·¢?ф?°??an_id:661[15:06:27:435] -?μ?ф???′°??n_id:661[15:06:57:465] -l???г?1??±??????ˉ·¢?ф?°??an_id:661[15:06:57:467] -?μ?ф???′°??n_id:661[15:07:27:487] -l???г?1??±??????ˉ·¢?ф?°??an_id:661[15:07:27:488] -?μ?ф???′°??n_id:661[15:07:28:316] -θ1??¤П3???С£?£?£[15:07:57:519] -连接空闲超过限定时间,系统主动发送心跳包, chan_id:661[15:07:57:521] -收到心跳回复包, chan_id:661[15:08:27:552] -连接空闲超过限定时间,系统主动发送心跳包, chan_id:661[15:08:27:553] -收到心跳回复包, chan_id:661[15:08:57:583] -连接空闲超过限定时间,系统主动发送心跳包, chan_id:661[15:08:57:585] -收到心跳回复包, chan_id:661[15:09:04:803] -向18911111111用户发送1条下行短信, SequenceId:9[15:09:04:874] -收到短信返回包,msg_id:59106104111509000001, mobile:18911111111, result:0[15:09:05:814] -收到SMGP30状态报告, moible:18911111111, msg_id:59106104111509000001, Status:MX:0001, Err:001[15:09:27:597] -连接空闲超过限定时间,系统主动发送心跳包, chan_id:661[15:09:27:598] -收到心跳回复包, chan_id:661[15:09:28:320] -网关守护线程运行中。。。[15:09:57:629] -连接空闲超过限定时间,系统主动发送心跳包, chan_id:661[15:09:57:630] -收到心跳回复包, chan_id:661[15:10:27:661] -连接空闲超过限定时间,系统主动发送心跳包, chan_id:661[15:10:27:662] -收到心跳回复包, chan_id:661[15:10:57:693] -连接空闲超过限定时间,系统主动发送心跳包, chan_id:661[15:10:57:694] -收到心跳回复包, chan_id:661^A[15:11:27:725] -连接空闲超过限定时间,系统主动发送心跳包, chan_id:661[15:11:27:726] -收到心跳回复包, chan_id:661[15:11:28:336] -网关守护线程运行中。。。^C[smsplatform@localhost runlogs]$
五、Redis日常维护操作(集合)
ROOT用户下:
检查redis是否启动成功:
ps -ef | grep redis
重启redis命令:nohup /usr/local/redis/bin/redis-server /usr/local/redis/etc/redis.conf
启动redis命令:/usr/local/redis/bin/redis-server /usr/local/redis/etc/redis.conf
netstat -tunpl | grep 6379#查看端口是否占用。
[root@oracledb ~]# cd /usr/local/redis/bin
[root@oracledb bin]#./redis-server /usr/local/redis/etc/redis.conf #打开服务
[root@oracledb ~]#./redis-cli shutdown #关闭服务
[root@bogon bin]# redis-cli 进入客户端
redis 127.0.0.1:6379> keys *
127.0.0.1:6379> keys chan* 查看队列
1) "chantask:queue:325:2"
2) "chantask:queue:136:2"
3) "chantask:queue:1038:1"
4) "chantask:queue:1339:0"
5) "chantask:queue:136:0"
127.0.0.1:6379> llen chantask:queue:325:2 查看具体队列的等待发送条数
删除队列信息:del chantask:queue:325:2
