@changedi
2019-07-03T11:52:06.000000Z
字数 3945
阅读 2267
JStorm 监控UI
JStorm
MemoryUsed
cluster/topology/worker使用到的物理内存
HeapMemory
cluster/topology/worker JVM使用到的堆内存
CpuUsedRatio
cluster/topology/worker cpu利用率,62.000 表示使用0.62个cpu,200.00表示使用2个cpu
NettyCliSendSpeed
cluster/topology/worker当前发送流量,单位字节/每秒
NettySrvRecvSpeed
cluster/topology/worker当前接收流量,单位字节/每秒
FullGc
cluster/topology/worker当前1分钟 full gc 次数
RecvTps
cluster/topology/component/task/stream 接收到的tuple的tps。
SendTps
cluster/topology/component/task/stream 发送tuple的tps。
Emitted
cluster/topology/component/task/stream 当前1分钟发送的消息数,包括业务消息和acker消息。
Acked
cluster/topology/component/task/stream 当前1分钟被ack的消息数。注意这个和Emitted的区别:
如果打开了acker机制, emitted的消息里面含有acker消息, 经常emitted 消息数量是acker消息数量的2倍。
Failed
cluster/topology/component/task/stream 当前1分钟 被ack失败的消息数(可能是没有完全处理,也可能是超时)。
Component 级别
EmitTime
component/task/stream, 这是spout/bolt将消息发布到disruptor队列中的时间,单位为微秒, JStorm从2.1.0开始所有时间相关的单位均为微秒。
DeserializeTime
component/task/stream, TaskReceiver中对一个tuple做反序列化的时间,单位为微秒。
SerializeTime
component/task/stream, TaskTransfer中对一个tuple做序列化的时间,单位为微秒。
ExecutorTime
component/task/stream, 只在spout中存在,nextTuple所花费的时间,单位为微秒。
ProcessLatency
component/task/stream, 这个是bolt execute消耗的时间,单位为微秒, 具体来说,就是从processTuple时,
tuple被放进pending map时会给一个时间, 到调用ack的时候从pending map中取出来,用当前时间减去放入的时间,即为ProcessLatency。
如果是spout,则为从消息最初从spout发出,一直到最后收到acker的ack消息的完整时间。
在spout中,由于ProcessLatency意味着一个tuple走完了所有的bolt最后被ack, 因此通常会比较大(一般会比TupleLifeCycle还要大)。
TupleLifeCycle
component/task/stream, 这个是一个tuple或者一个batch从上一级component中被emit出来,单位为微秒,
到当前component接收到这个tuple或者batch的时间,这段时间包括了上游序列化时间、网络发送和下游反序列化时间的总和
Task 级别
DeserializeQueue
反序列化队列堆积情况。补充说明,一个task 有4个队列, 反序列化队列,执行队列,控制消息队列,序列化队列。
SerializeQueue
序列化队列堆积情况。补充说明,一个task 有4个队列, 反序列化队列,执行队列,控制消息队列,序列化队列。
ExecutorQueue
执行队列堆积情况。补充说明,一个task 有4个队列, 反序列化队列,执行队列,控制消息队列,序列化队列。
CtrlQueue
控制执行队列的堆积情况。补充说明,一个task 有4个队列, 反序列化队列,执行队列,控制消息队列,序列化队列。
PendingNum
只对spout有效,表示 spout 中已经发送了但还没有ack的tuple数量
BatchInterval
性能调优使用, 表示2次batch打满时,间隔微秒
Worker 级别
GCCount
当前1分钟gc的次数
GCTime
当前1分钟gc所花费的时间之和,单位是微妙
NettyCliSendBatchSize
当前1分钟worker 发送netty包的平均大小(Bytes)
NettySrvTransmitTime
当前1分钟,worker 解析netty包的耗时,单位微秒。
RecvCtrlQueue
worker级别的总接受控制队列堆积情况
SendCtrlQueue
worker级别的总发送控制队列堆积情况
supervisor 级别
DiskUsage
当前jstorm账户所在文件磁盘空间的利用率;
MemoryUsage
当前机器的内存利用率
CpuUsedRatio
当前机器的cpu利用率
NettyCliSendSpeed/NettySrvRecvSpeed
当前机器网卡每秒接收和发送字节数
基本概念
- Task - “任务”是拓扑spout或者bolt的单个执行线程。拓扑在集群中执行尽可能多的工作进程,每个spout和bolt执行尽可能多的线程。每个工作进程在其中包含一些用于一些spout或bolt。例如,您可能在所有组件中指定了300个线程,并在配置中指定了50个工作进程。每个工作进程将执行6个线程,每个线程可以属于不同的组件。您可以通过调整每个组件的并行度以及这些线程应运行的工作进程数来调整Storm拓扑的性能。
- Latency - 由于bolt正在缓冲元组并将批处理写入数据库,因此延迟是故意的。 stat测量接收元组和标记为已完成(acked)之间的时间,并且该bolt仅在将元组写入db后才会ack。
- Emitted - Emitted是在OutputCollector上调用其中一个“emit”方法的次数。
- Transfered - 已传输是发送到其他任务的实际元组的数量。
EX:如果“bolt-B”有5个任务并使用“all”分组订阅“bolt-A”,则“Transfered”将为该bolt A做5倍的“emitted”。类似地,如果bolt A发出流 没有ack; “Transfered”将为0。
Cluster Summary

- Version – UI节点上安装的storm版本。[假设所有节点都具有相同的storm版本]
- Nimbus up-time - 当前Nimbus实例运行的持续时间。 (请注意,storm群集可能已经部署并且可用的时间比当前Nimbus进程运行的时间长得多。)。 由于nimbus是storm集群中最高级别的协调员。 Nimbus正常运行时间仅在大多数时间作为群集正常运行时间。然而,这并非总是如此。
- Supervisors - 集群当前的节点数
- Total slots - 集群中的worker数(进程数)[您必须定义每台机器的slot数量,并且其大部分时间与机器中的核心数量相同]
- Used slots – 已经占用的worker数
- Free slots – 空闲的workder数
- Tasks – 一个Task是一个Bolt或者Spout的实例。如果将spout和bolt的并发数sum起来,就等于task数。
- Executors – 线程数,线程属于worker进程。你可以指定一个executor有多少个task。需要比较好的理解storm的并行机制来理解这个数字。
Topology Summary

- Name – 提交topology时起的名字。可以点击查看拓扑信息。
- Id – 运行拓扑时的唯一ID。
- Status – 状态,可以是ACTIVE, INACTIVE, KILLED, 或者 REBALANCING。
- Uptime - 拓扑提交后的时间。
- Num workers - 当前拓扑使用的worker数。 和你定义拓扑配置时一样。
- Num executors - 当前拓扑使用的executor数。
- Num tasks - 当前拓扑的task数。
- Operation - 拓扑的四种操作,Activate将拓扑激活。Deactivate设置拓扑为inactive的,此时uptime不受影响。Re-balance动态的增减worker。管理员不需要重启集群拓扑。Kill就是停止拓扑并从storm集群中移除。在storm UI界面也不再可见,需要管理员重新部署才行。
Supervisor Summary
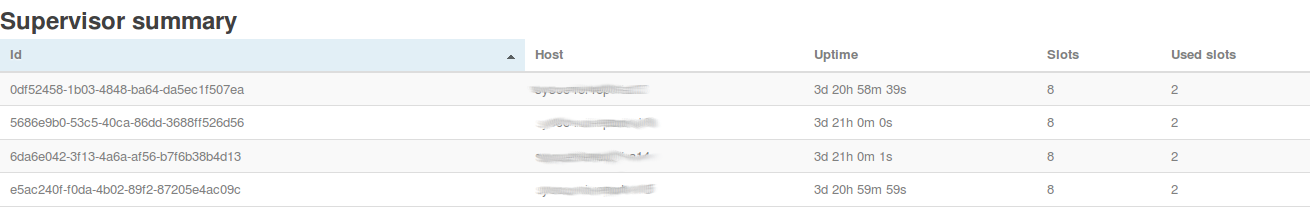
- Id – Supervisor的唯一ID,加入cluster时就有。
- Host – 远程主机的host。
- Up-time – supervisor注册到集群后的时间。
- Slots – 该主机从属的worker数。一般情况storm均匀分配所有的worker在集群的所有主机上。
- Used slots – 该主机上已经使用的worker数。
Topology stats
- Window – 统计最近的一个时间窗口周期。
- Emitted – 已经emit的tuple数量。
- Transferred – emit的并且发给一个或多个bolt的tuple数量。
- Complete latency – 拓扑中一个tuple“树”完成处理的平均时间。如果是0说明没有ack。
- Acked – tuple“树”成功处理的数量。如果是0说明没有ack。
- Failed – tuple“树”在ack完成前fail或者timeout的数量。如果是0说明没有ack。
