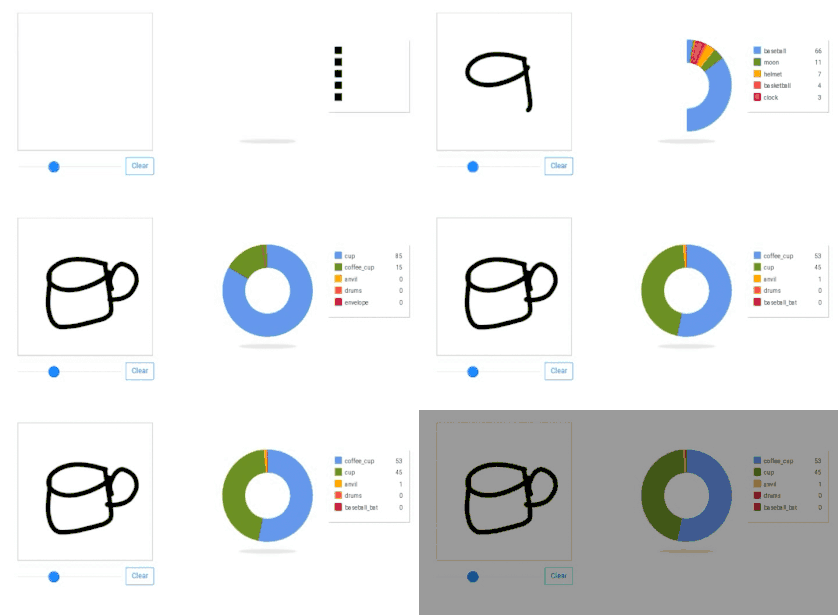
@sambodhi
2018-07-04T23:24:03.000000Z
字数 3767
阅读 2769
Train a model in tf.keras with Colab, and run it in the browser with TensorFlow.js
CSDN
作者|Zaid Alyafeai
译者|婉清
编辑|爱艳
出品|
我们将创建一个简单的工具来识别图画并输出当前图画的名称。这款应用将直接在浏览器上运行,无需任何安装。我们将使用Google Colab来训练模型,使用TensorFlow.js在浏览器上进行部署。

代码和演示
你可以在GitHub(https://zaidalyafeai.github.io/sketcher/)找到在线演示和代码。另外,你要务必在
https://colab.research.google.com/github/zaidalyafeai/zaidalyafeai.github.io/blob/master/sketcher/Sketcher.ipynb 测试Google Colab的notebook工具。
数据集
我们将使用CNN来识别不同类型的图画。CNN将在Quick Draw数据集上(https://github.com/googlecreativelab/quickdraw-dataset)进行训练。这个数据集包含了大约5000万张、345类别的图画。

类别的一个子集
管道
我们将使用Keras在Google Colab上免费在GPU上训练模型,然后使用TensorFlow.js(tfjs)在浏览器上直接运行。我在TensorFlow.js上创建了一个指南(https://medium.com/tensorflow/a-gentle-introduction-to-tensorflow-js-dba2e5257702),在继续之前请一定要先阅读这份指南。以下是该项目的管道:

管道
在Colab上训练
Google在GPU上提供免费的处理能力。你可以在这份教程中了解如何创建notebo并激活GPU编程:https://medium.com/deep-learning-turkey/google-colab-free-gpu-tutorial-e113627b9f5d
Imports
我们将使用带有tensorflow后端的keras:

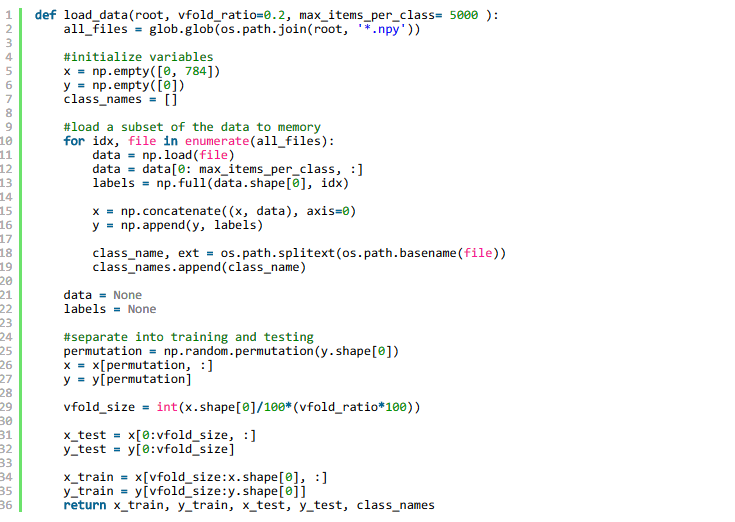
加载数据
由于我们的内存有限,我们不会在所有的类别进行训练。我们只使用100个类别的数据集(https://raw.githubusercontent.com/zaidalyafeai/zaidalyafeai.github.io/master/sketcher/mini_classes.txt)。在Google Cloud(https://console.cloud.google.com/storage/browser/quickdraw\dataset/full/numpy_bitmap?pli=1)上,每个类别的数据都可以用作形状为 [N,784] 的numpy数组,其中 N 是该特定类的的图像数量。我们首先下载数据集:

由于我们的内存有限,因此每个类只能加载5000个图像到内存。我们还保留了20%的用于测试的不可见数据。

预处理数据
我们对数据进行预处理,为训练做准备。该模型将采用形状 [N, 28, 28, 1] 的批次并输出形状 [N, 100] 的概率。

创建模型
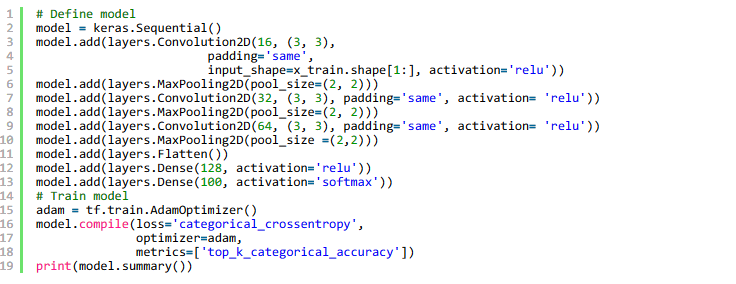
我们将创建一个简单的CNN。注意,参数数量越少,模型就越简单越好。实际上,我们将在浏览器上进行转换后运行模型,并且我们希望模型能够快速运行以便进行预测。下面模型包含了3个conv层和2个dense层。

适配、验证和测试
在此之后,我们对模型进行了5个轮数和256个批次的训练,并进行了10%的验证划分:

训练的结果如下图所示:

测试准确率中前5个准确率为92.20%
为Web格式准备模型
在我们对模型的准确率感到满意之后,我们将其保存并准备进行转换:

安装tfjs包进行转换:

然后转换模型:

这将创建一些权重文件和包含模型体系结构的json文件。
压缩模型,准备将其下载到我们的本地计算机中:

最后下载模型:

Inference on the Browser
推理在浏览器上
In this section we show how to load the model and make inference. I will assume that we have a canvas of size 300 x 300 . I will not go over the details of the interface and focus on TensorFlow.js part.
在本节中,我们将展示如何加载模型并进行推理。我假设我们有一个300 * 300大小的画布。我将不会详细介绍接口的细节,并关注于TensorFlow。js的部分。
Loading the Model
加载模型
In order to use TensorFlow.js first use the following script
为了使用张力流。js首先使用以下脚本

You will need a running server on your local machine to host the weight files. You can create an apache server or host the page on GitHub as I did on my project.
您将需要本地机器上的一个正在运行的服务器来托管权重文件。您可以创建一个apache服务器或在GitHub上托管页面,就像我在项目中所做的那样。
After that, load the model to the browser using
然后,使用浏览器加载模型

The await keyword waits for the model to be loaded by the browser.
等待关键字等待浏览器加载模型。
Preprocessing
预处理
We need to preprocess the data before making a prediction. First get the image data from the canvas
在做预测之前,我们需要先对数据进行预处理。首先从画布中获取图像数据

The getMinBox() will be explained later. The variable dpi is used to stretch the crop of the canvas according to the density of the pixels of the screen.
稍后将解释getMinBox()。变量dpi用于根据屏幕像素的密度对画布进行拉伸。
We take the current image data of the canvas convert it to a tensor, resize and normalize
我们将画布当前的图像数据转换为一个张量,调整大小并规范化.

For prediction we use model.predict this will return probabilities of the shape [N, 100]
对于预测,我们使用模型。预测这将返回形状的概率[N, 100]

We can then use simple functions to find the top 5 probabilities.
然后我们可以用简单的函数来求前5个概率。
Improve Accuracy
提高准确性
Remember that that our model accepts tensors of the shape [N, 28, 28,1] . The drawing canvas we have is of size 300 x 300 which might be two large for drawings or the user might draw a small figure. It will be better to crop only the box that contains the current drawing. To do that we extract the minimum bounding box around the drawing by finding the top left and the bottom right points
记住,我们的模型接受形状的张量[N, 28, 28,1]。我们的绘图画布大小为300×300,可能是两个大的用于绘图,或者用户可以绘制一个小图形。最好只裁剪包含当前图纸的盒子。为了做到这一点,我们通过找到左上方和右下方的点来提取绘图周围的最小边界框。

Testing Drawings
测试图纸
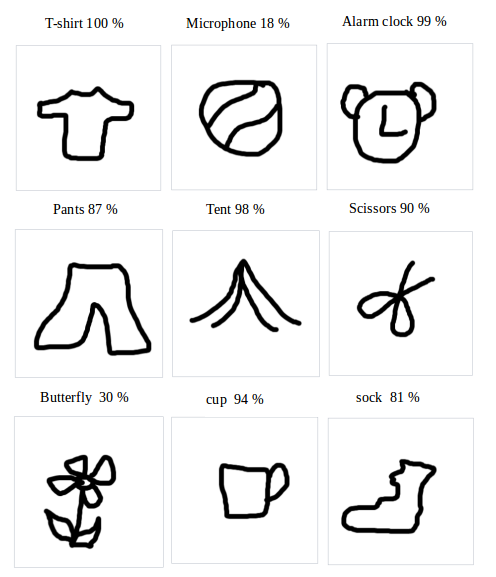
Here are some first time drawings and the highest percentage class. I made all the drawings with my mouse. You should get better accuracy using a pen …
这里有一些第一次绘图和最高的百分比类。所有的画都是我用鼠标画的。你应该使用一支笔来获得更好的准确度。

原文链接:Train a model in tf.keras with Colab, and run it in the browser with TensorFlow.js
https://medium.com/@alyafey22/train-on-google-colab-and-run-on-the-browser-a-case-study-8a45f9b1474e
