@mShuaiZhao
2018-03-20T02:37:17.000000Z
字数 2814
阅读 515
Statistics with R Part02Week03
Coursera 2018.03
t-distribution and comparing two means
1. introduction
说真的没啥写的。
2. t-distribution
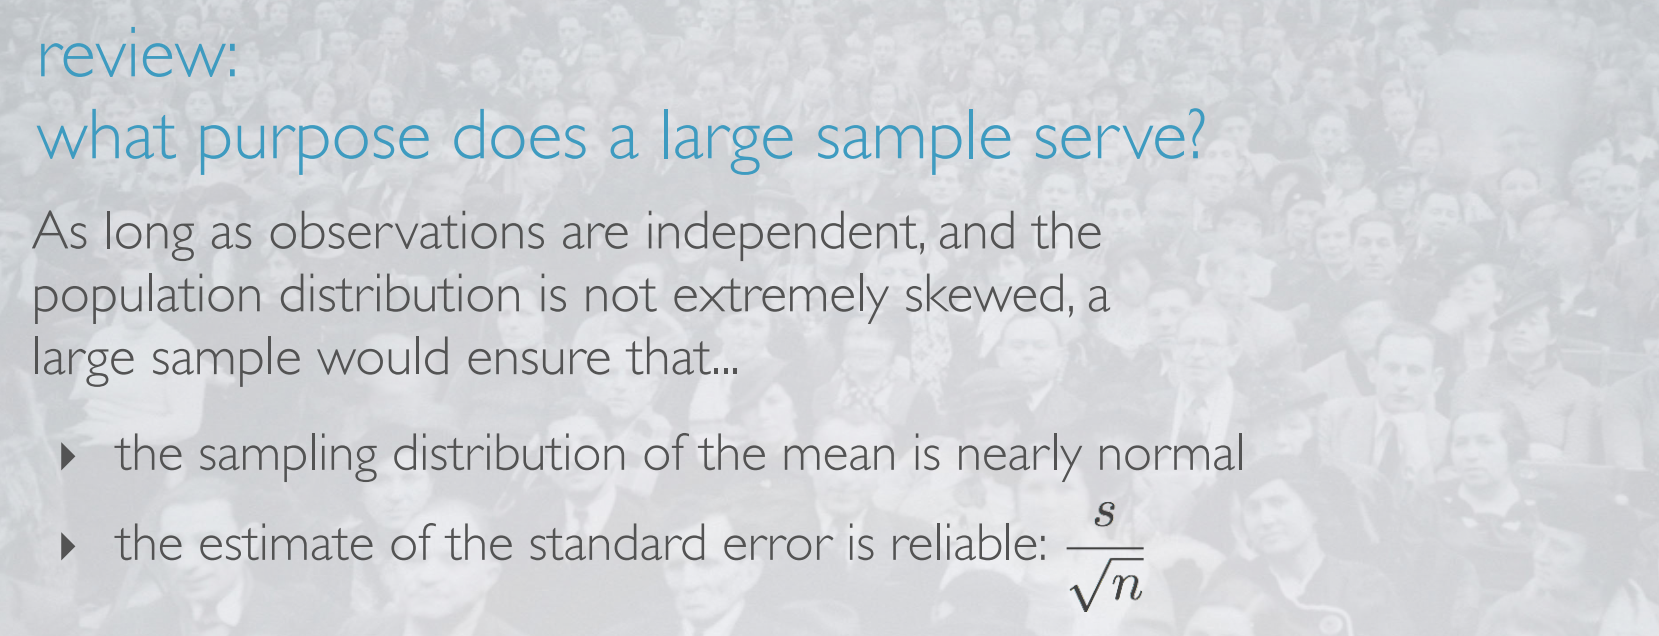
review
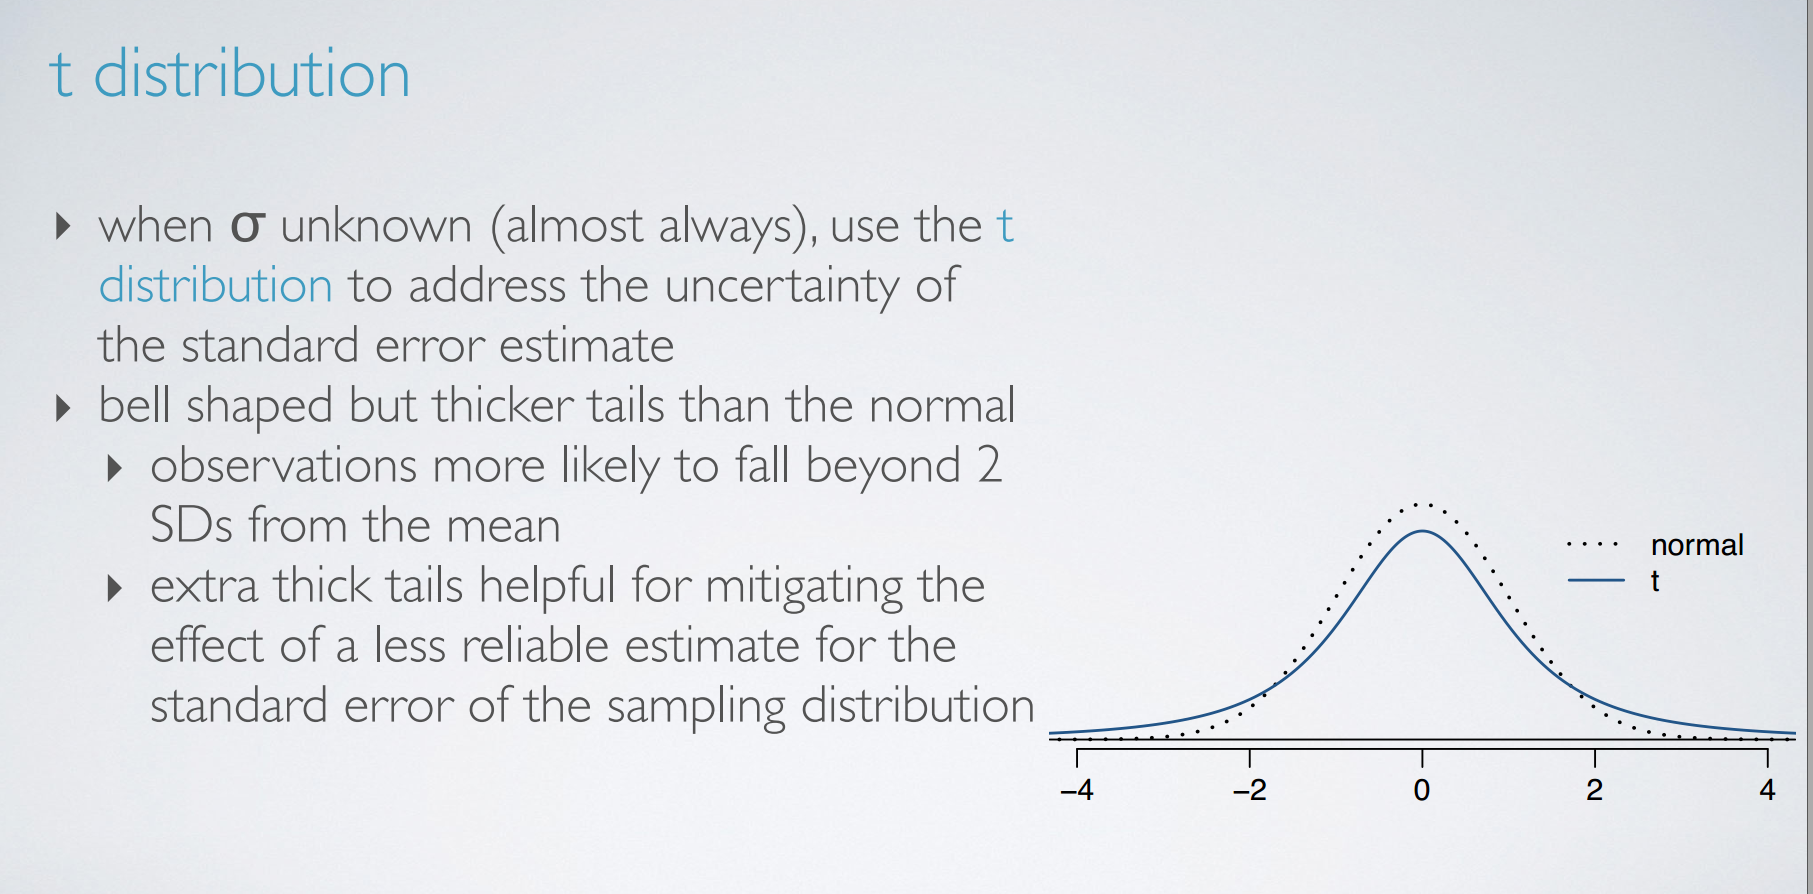
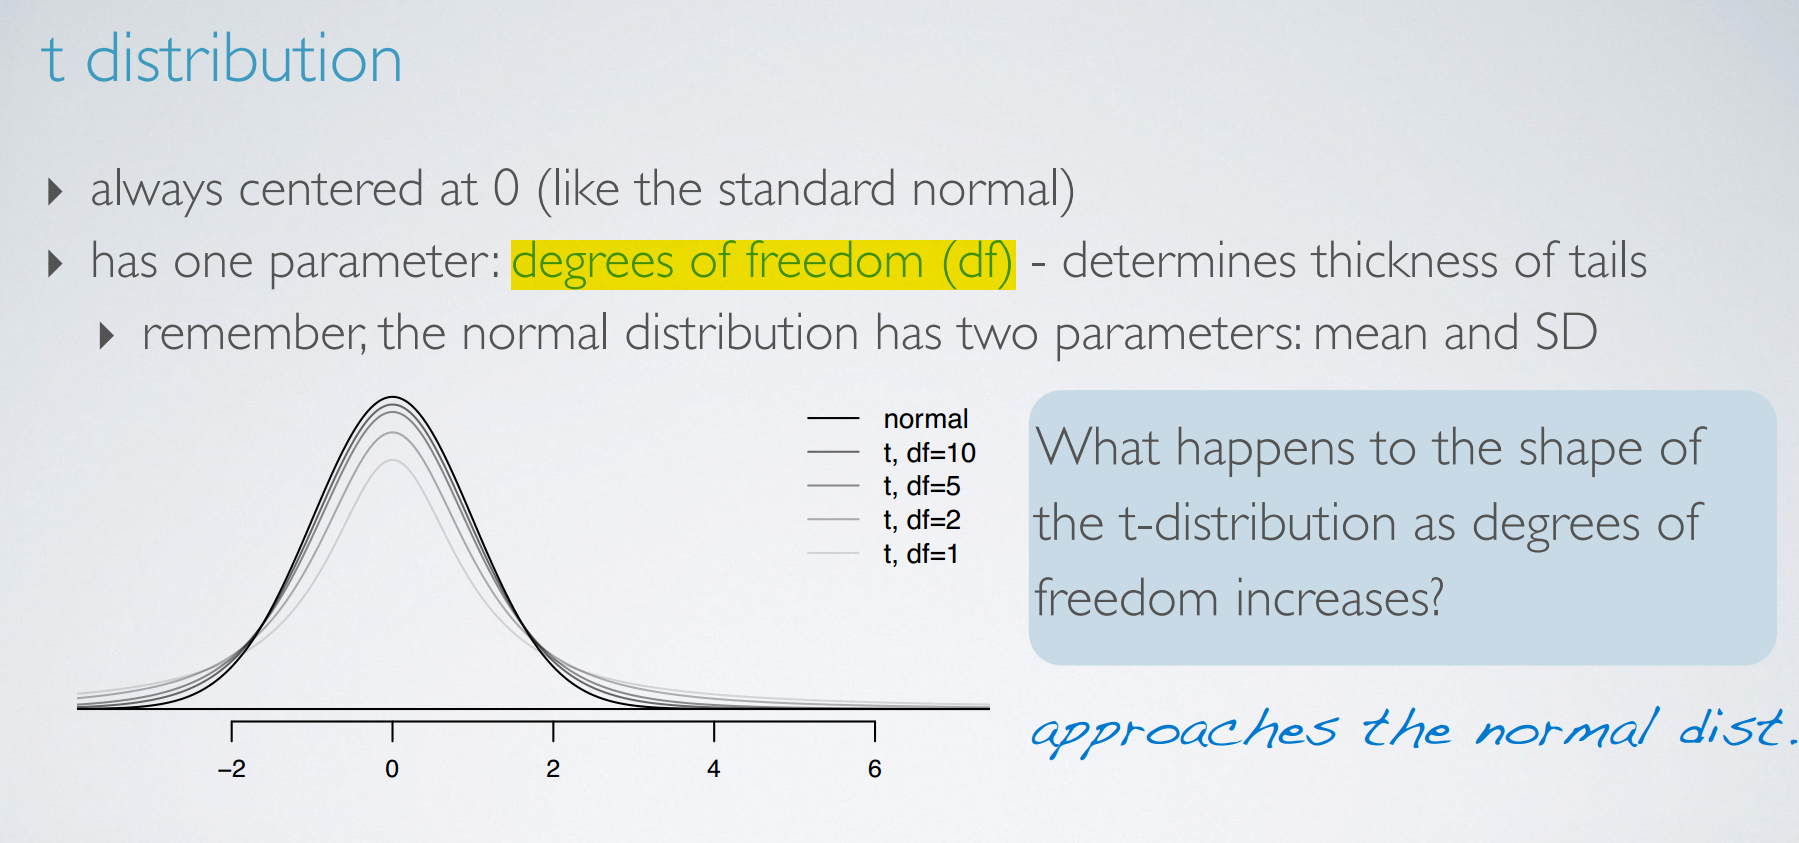
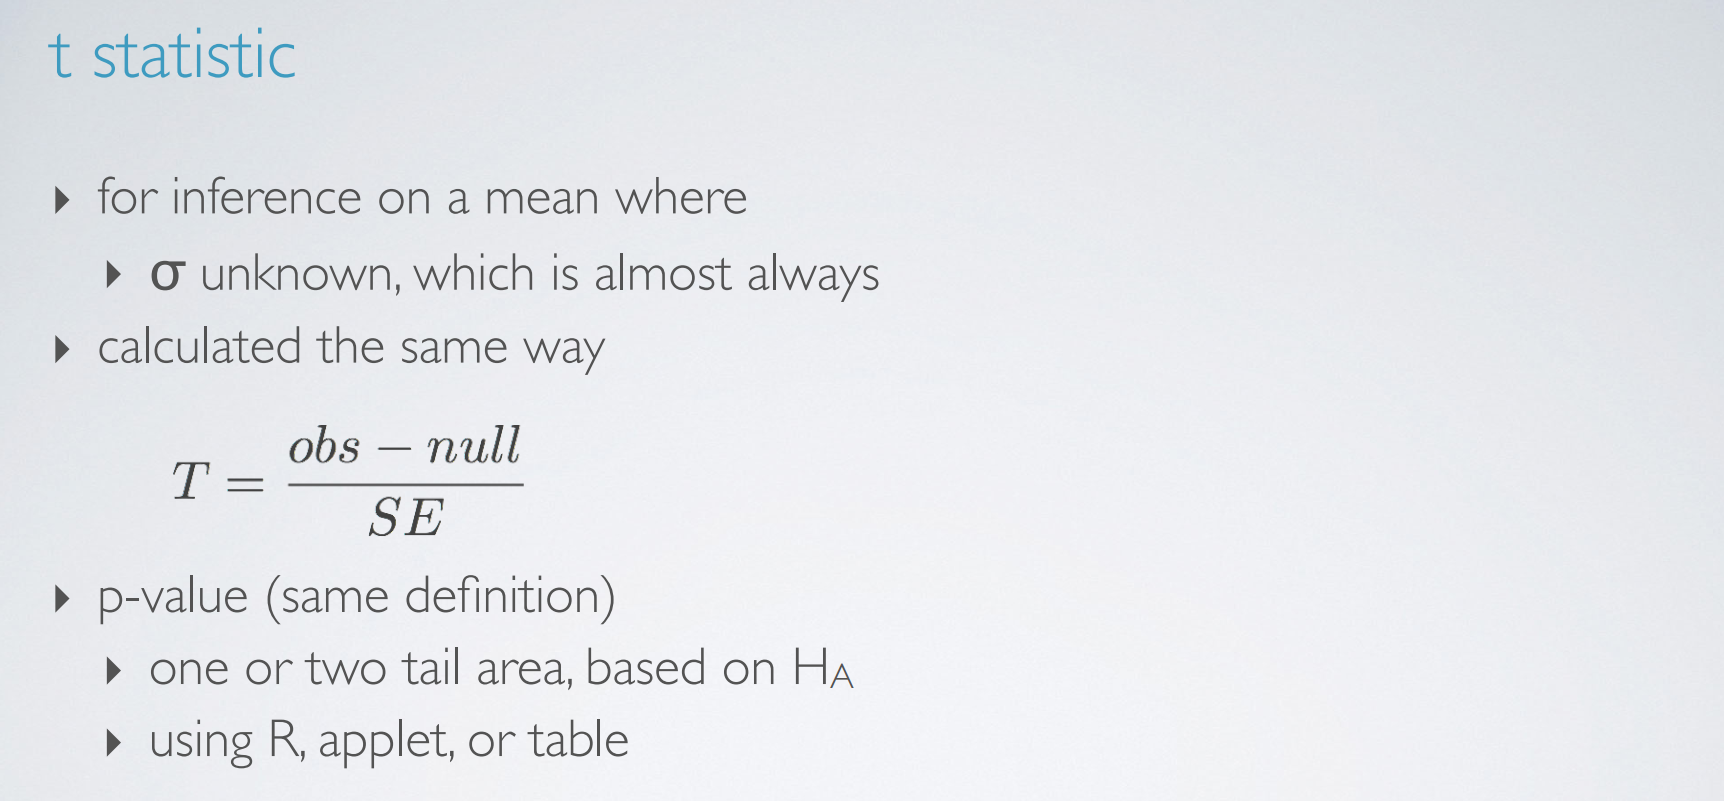
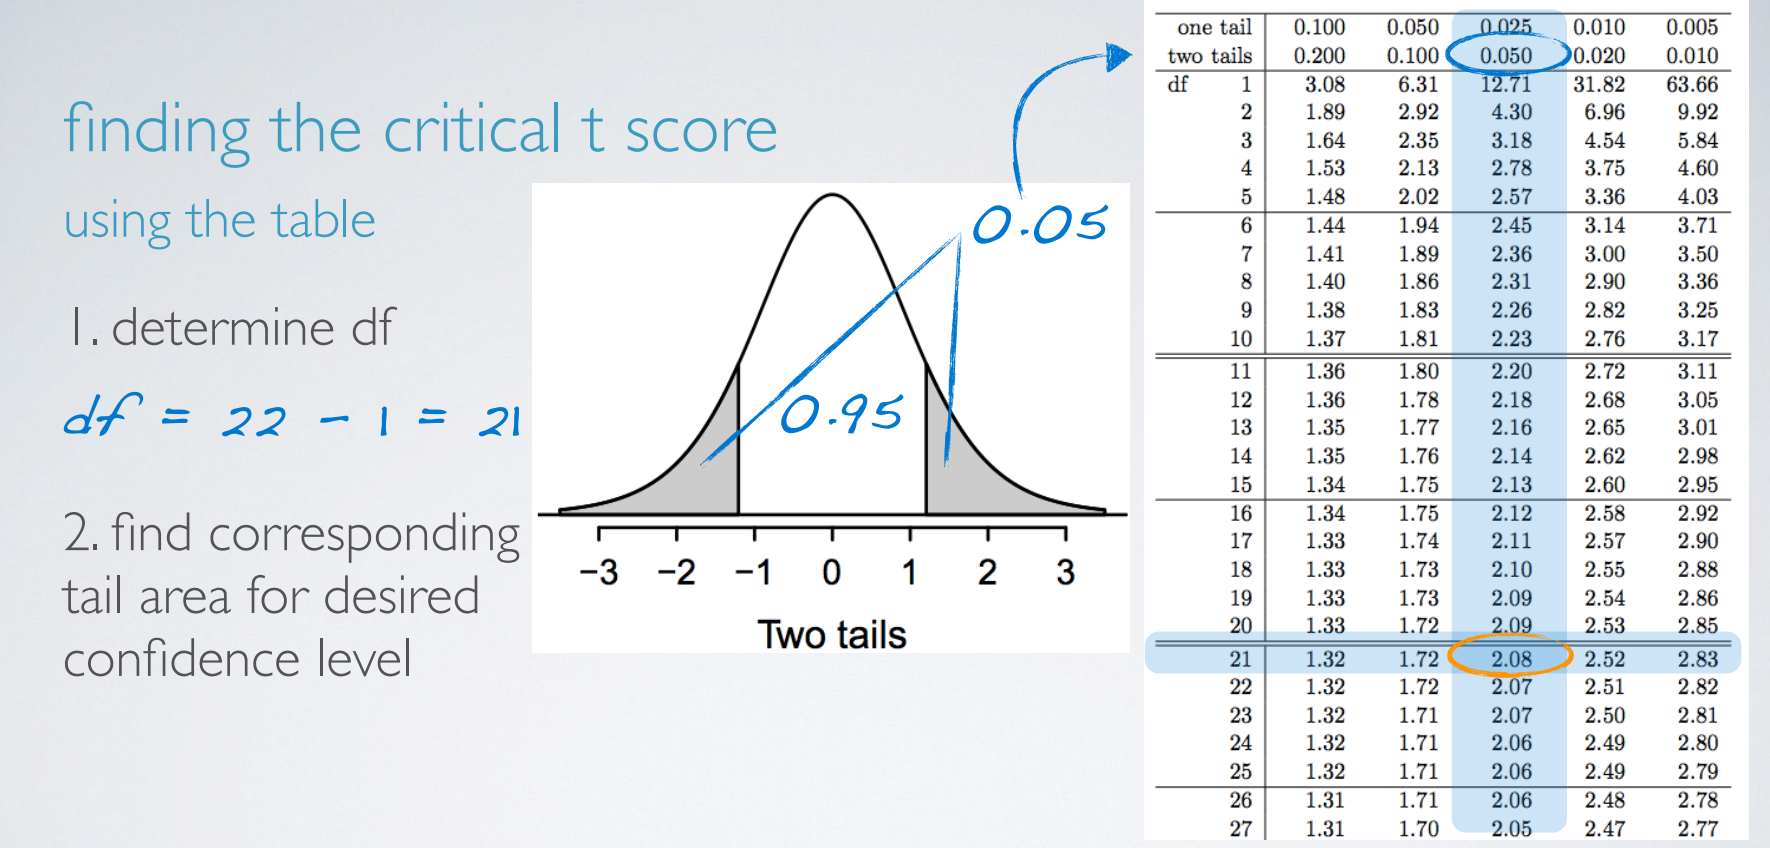
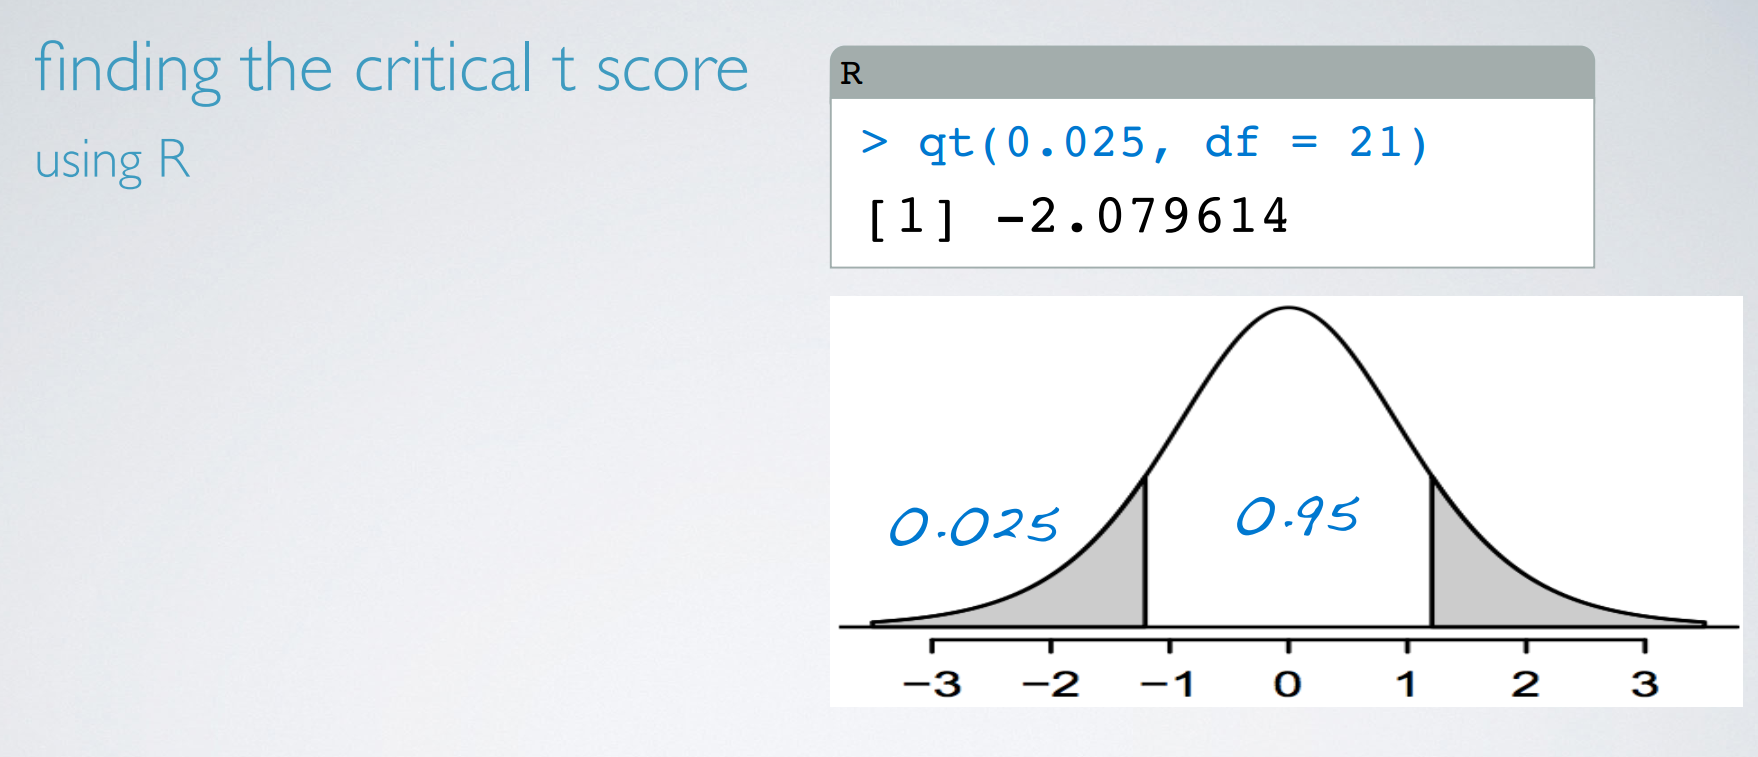
t distribution
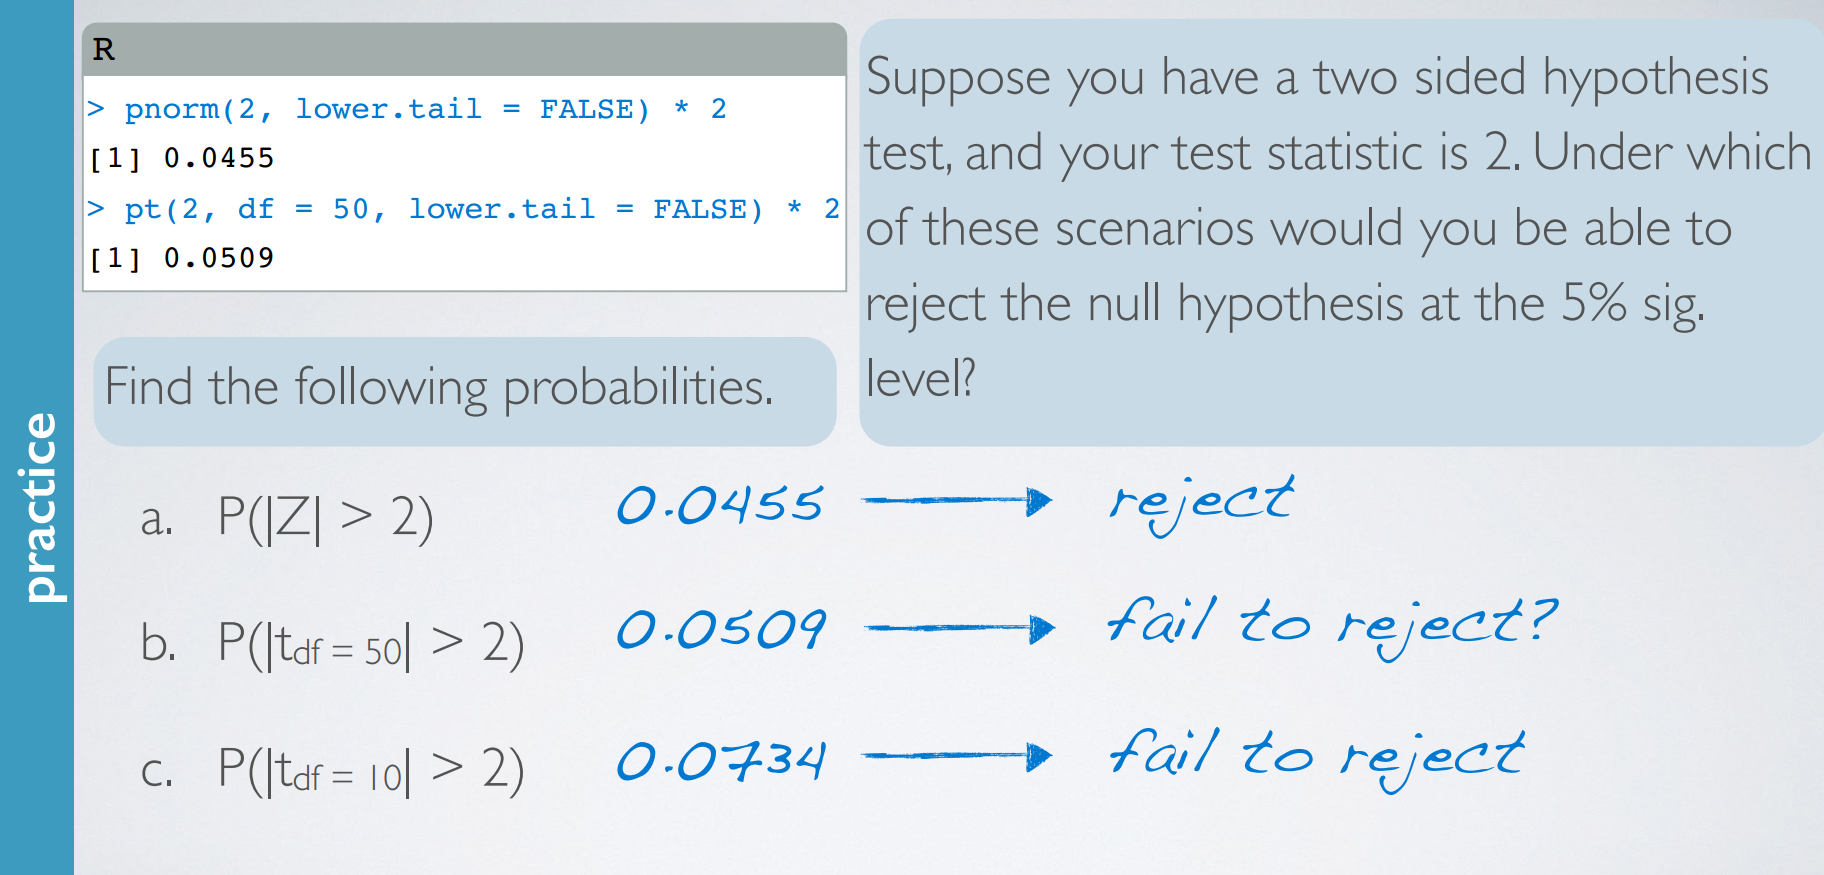
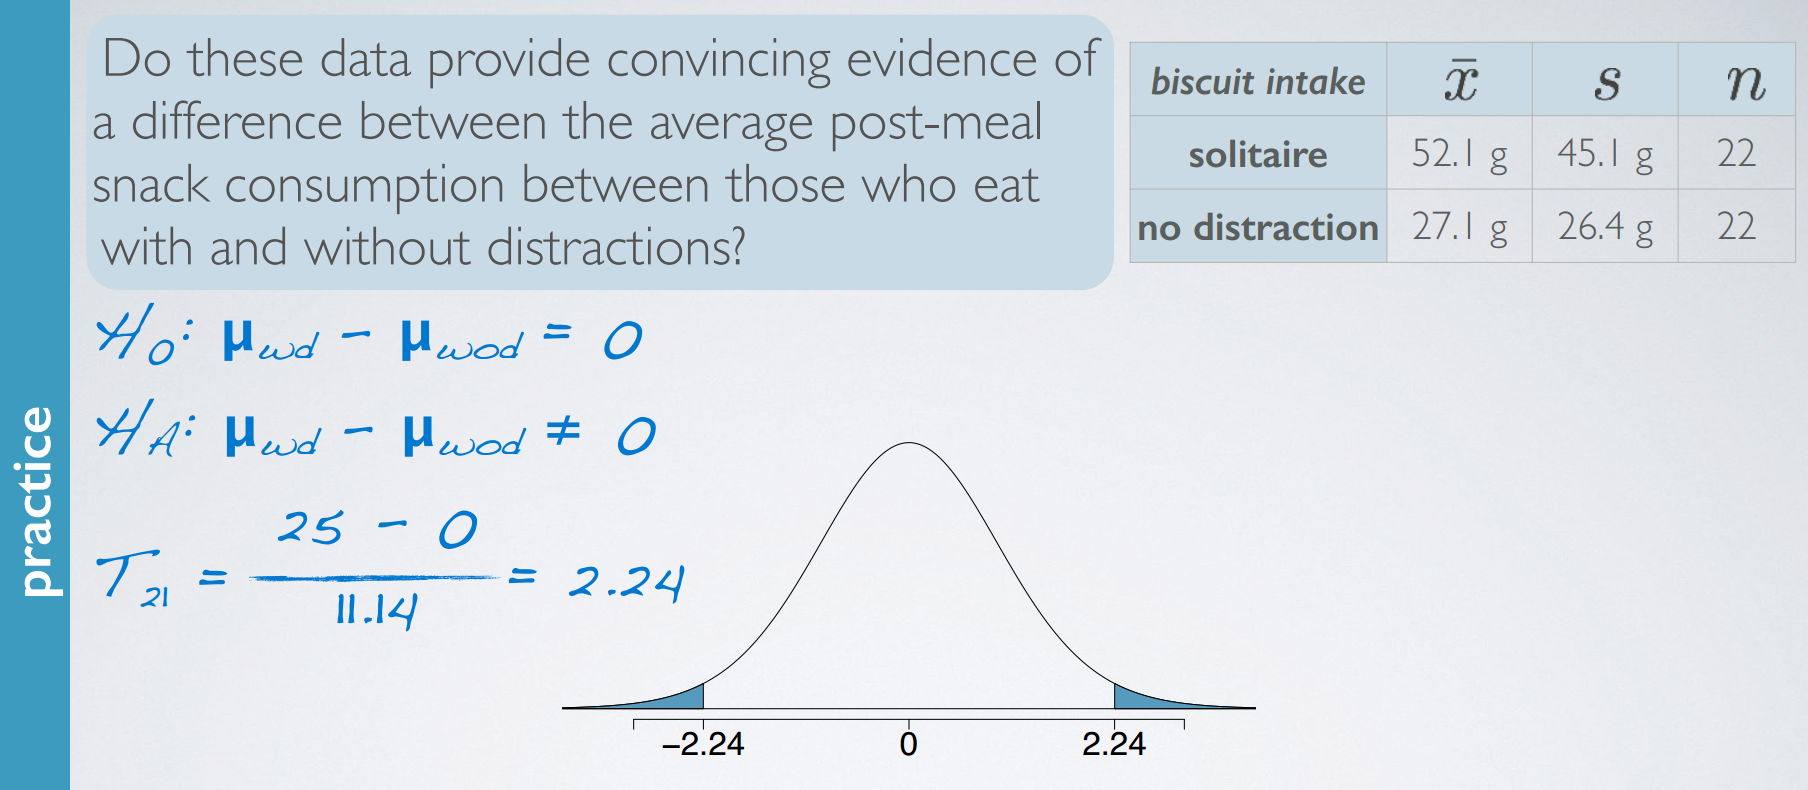
practice

3. Inference for a mean
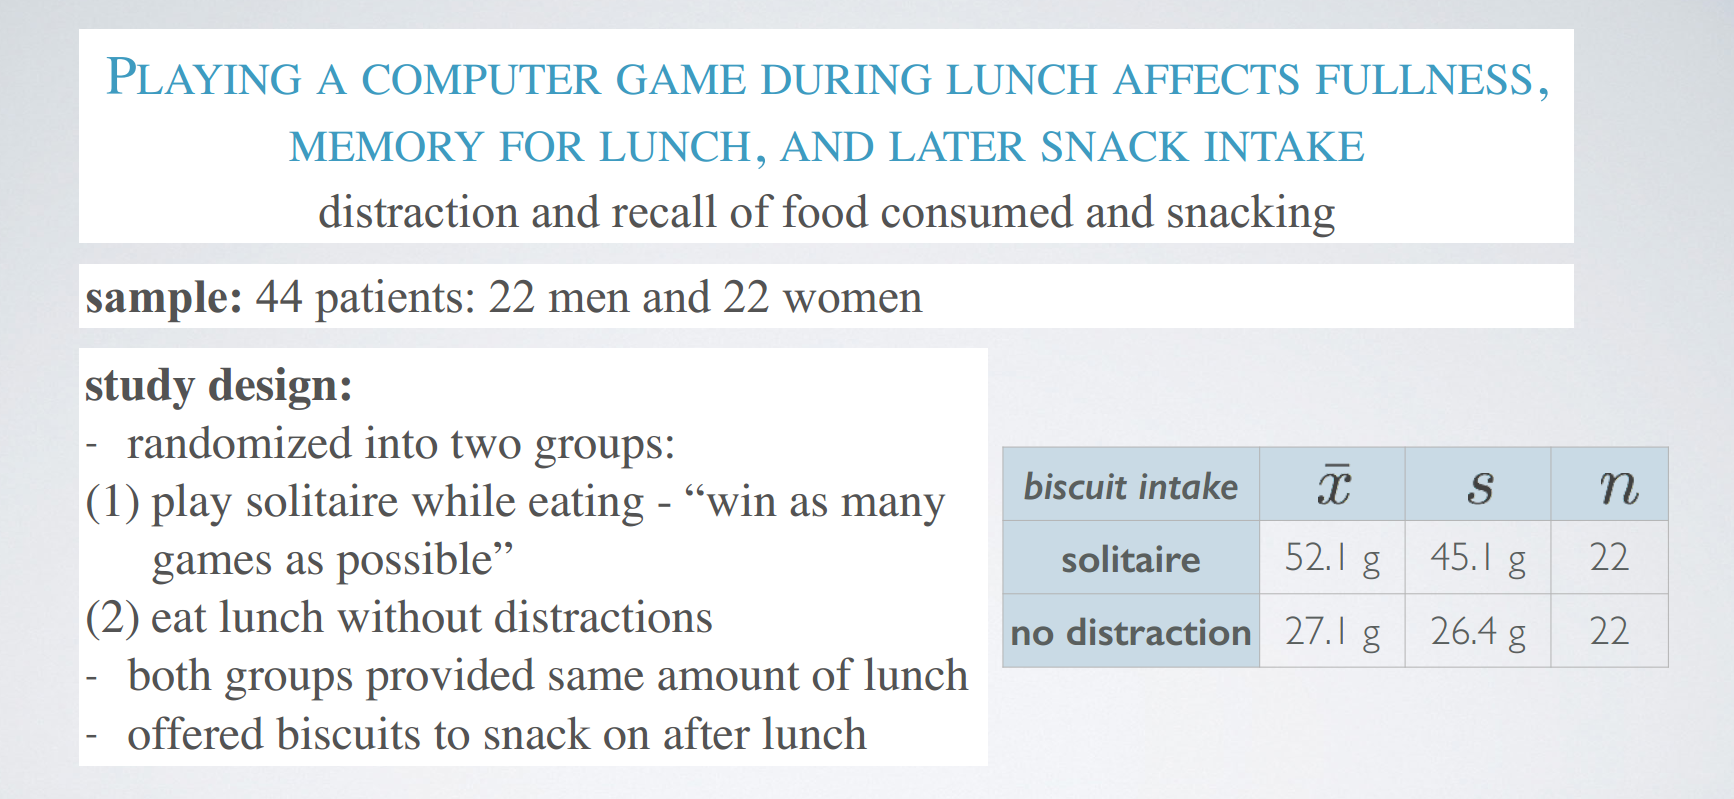
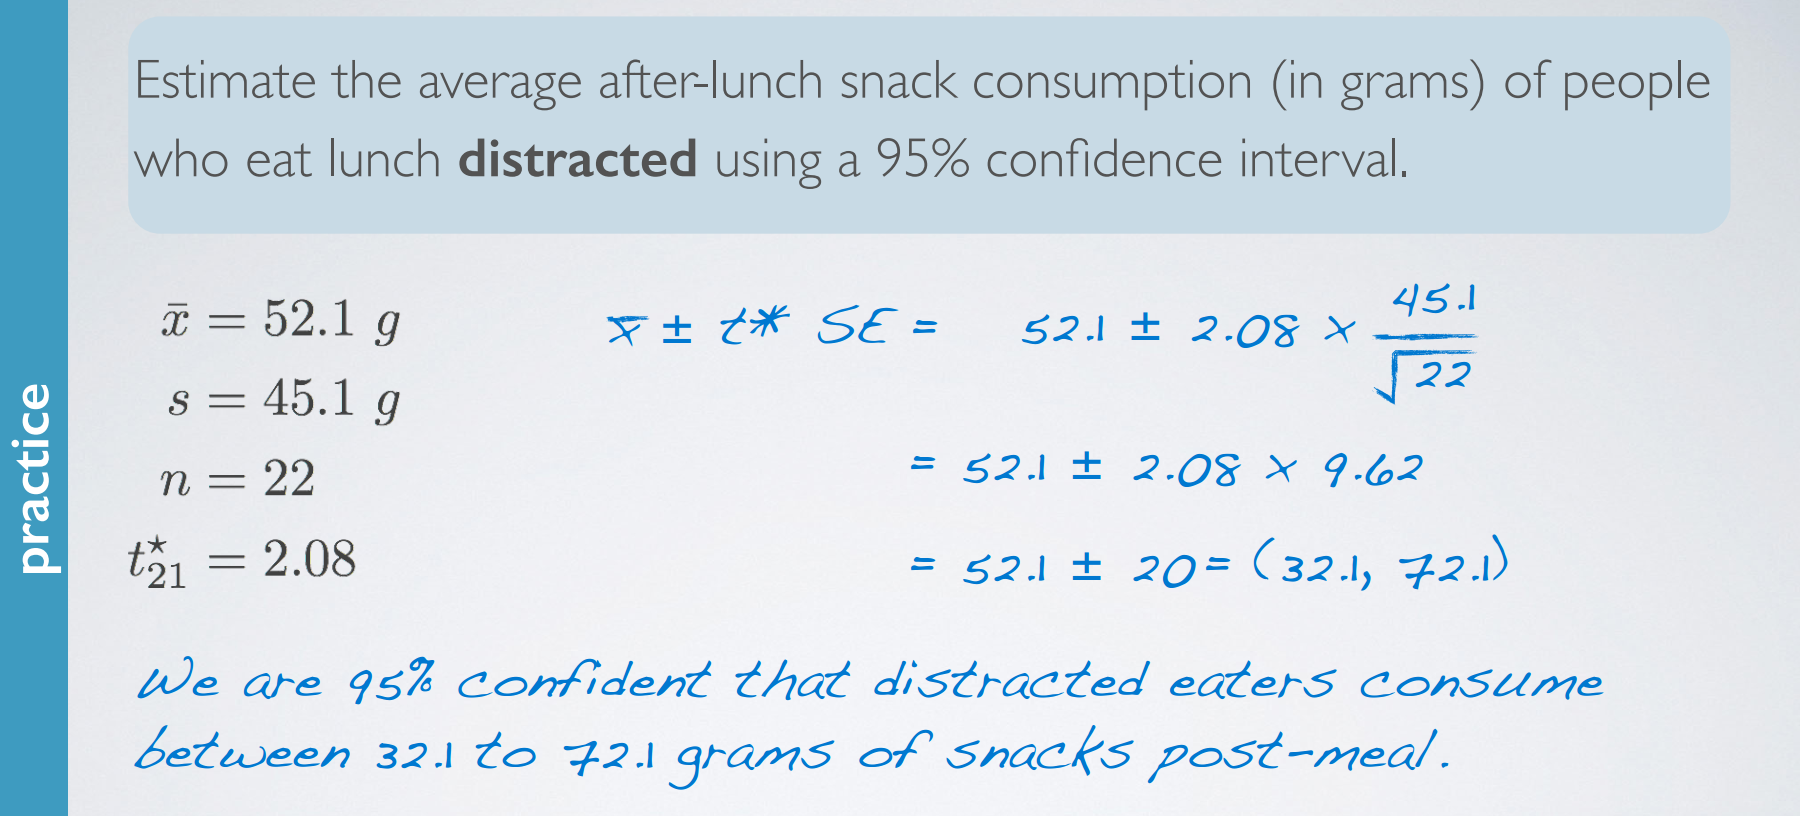
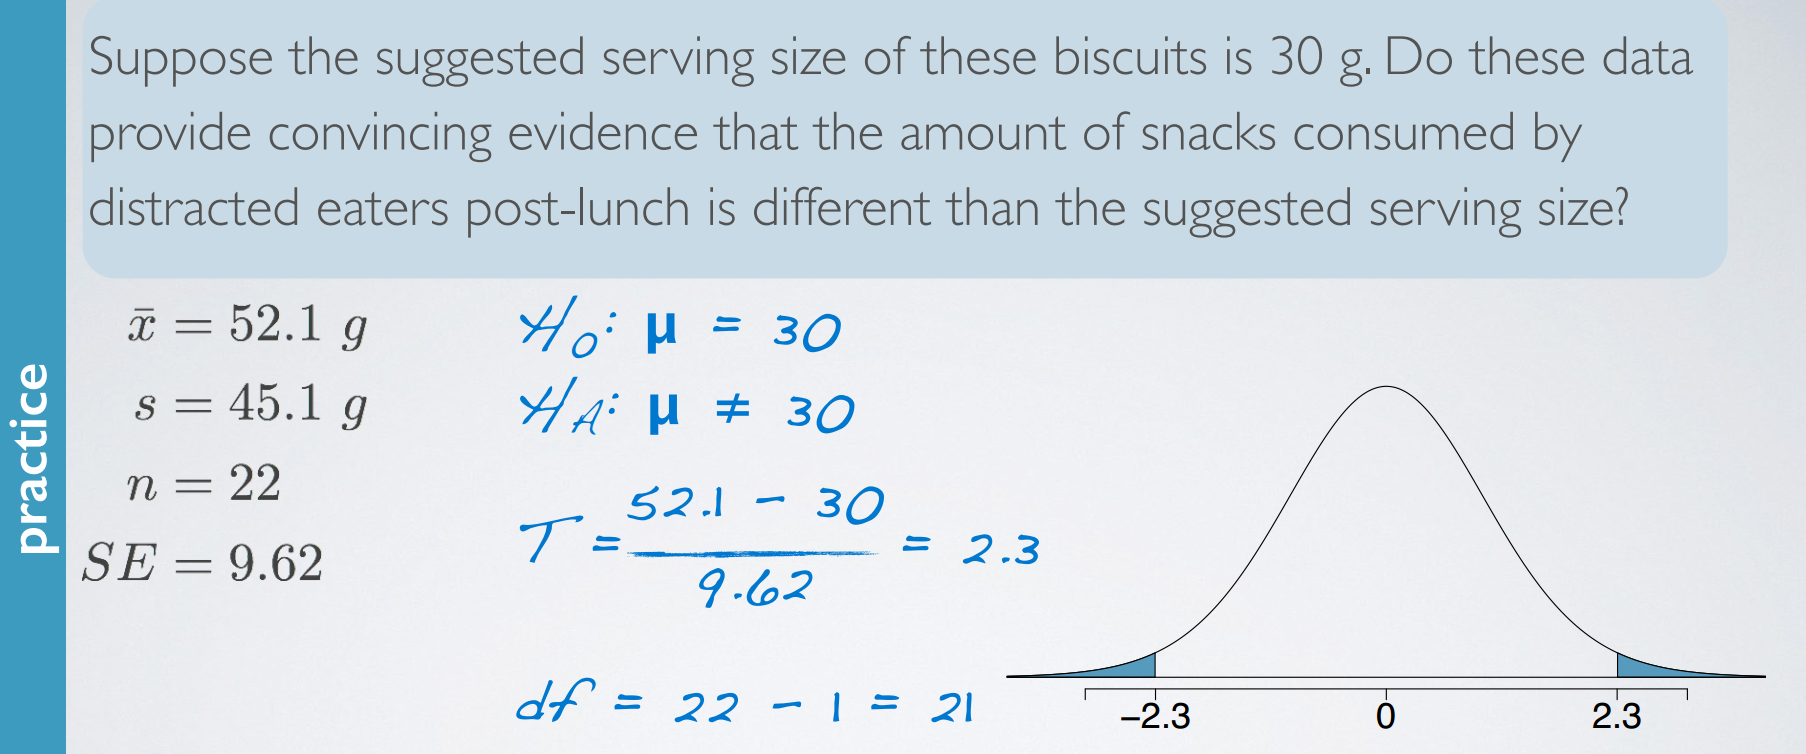
problem
estimating the mean
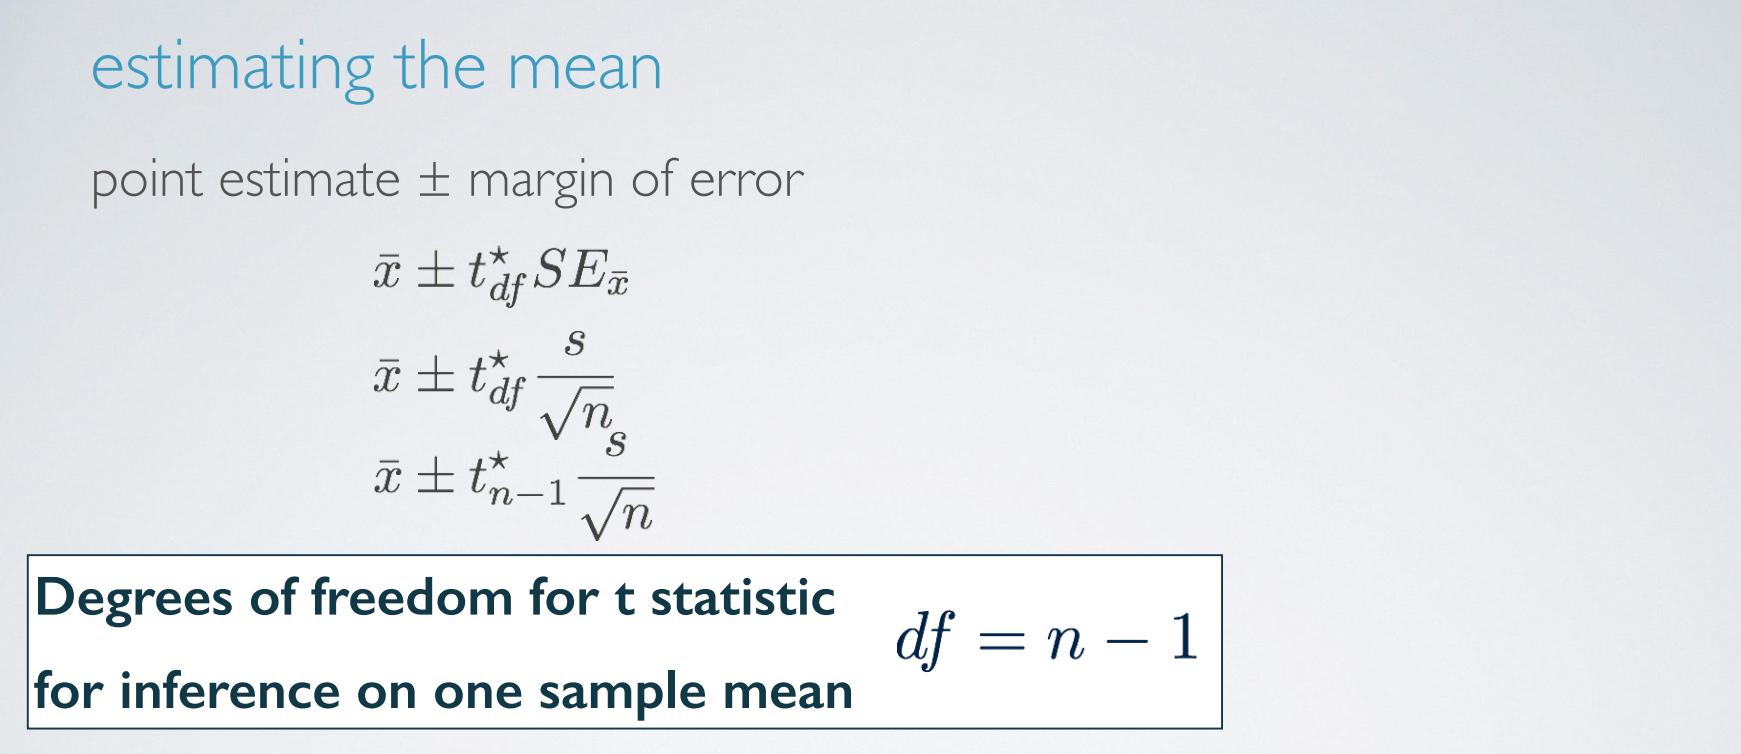
When working with data from only one sample, an estimating a single mean, the degrees of freedom is n-1. We lose one degree of freedom because we're estimating the standard error of the sample mean using the sample standard deviation.
recap

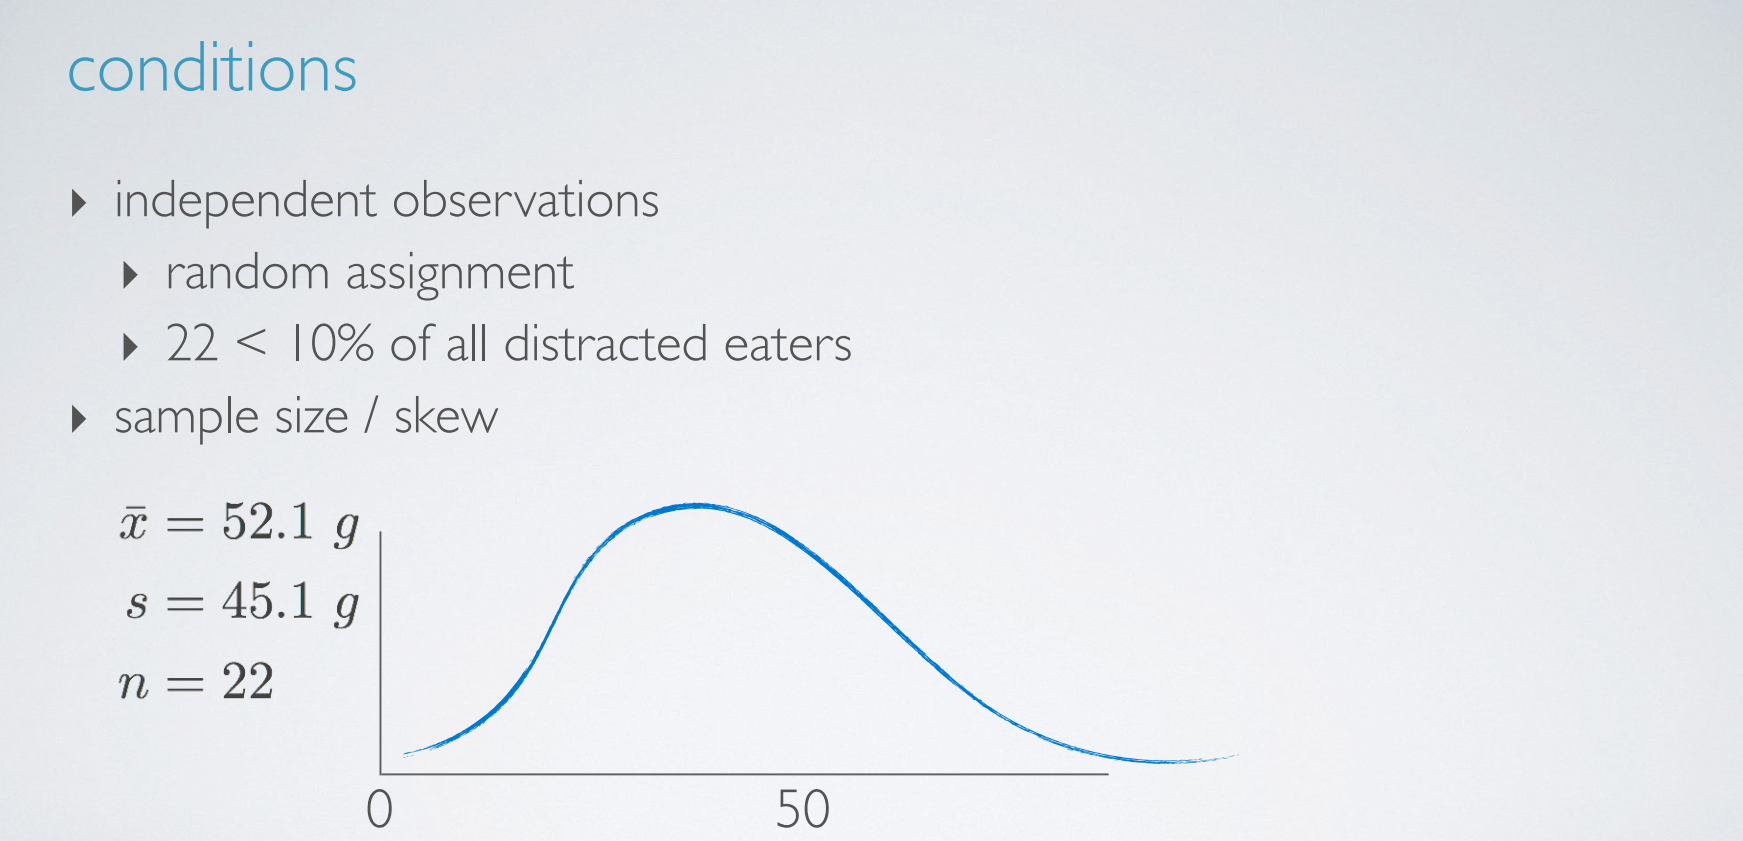
condition
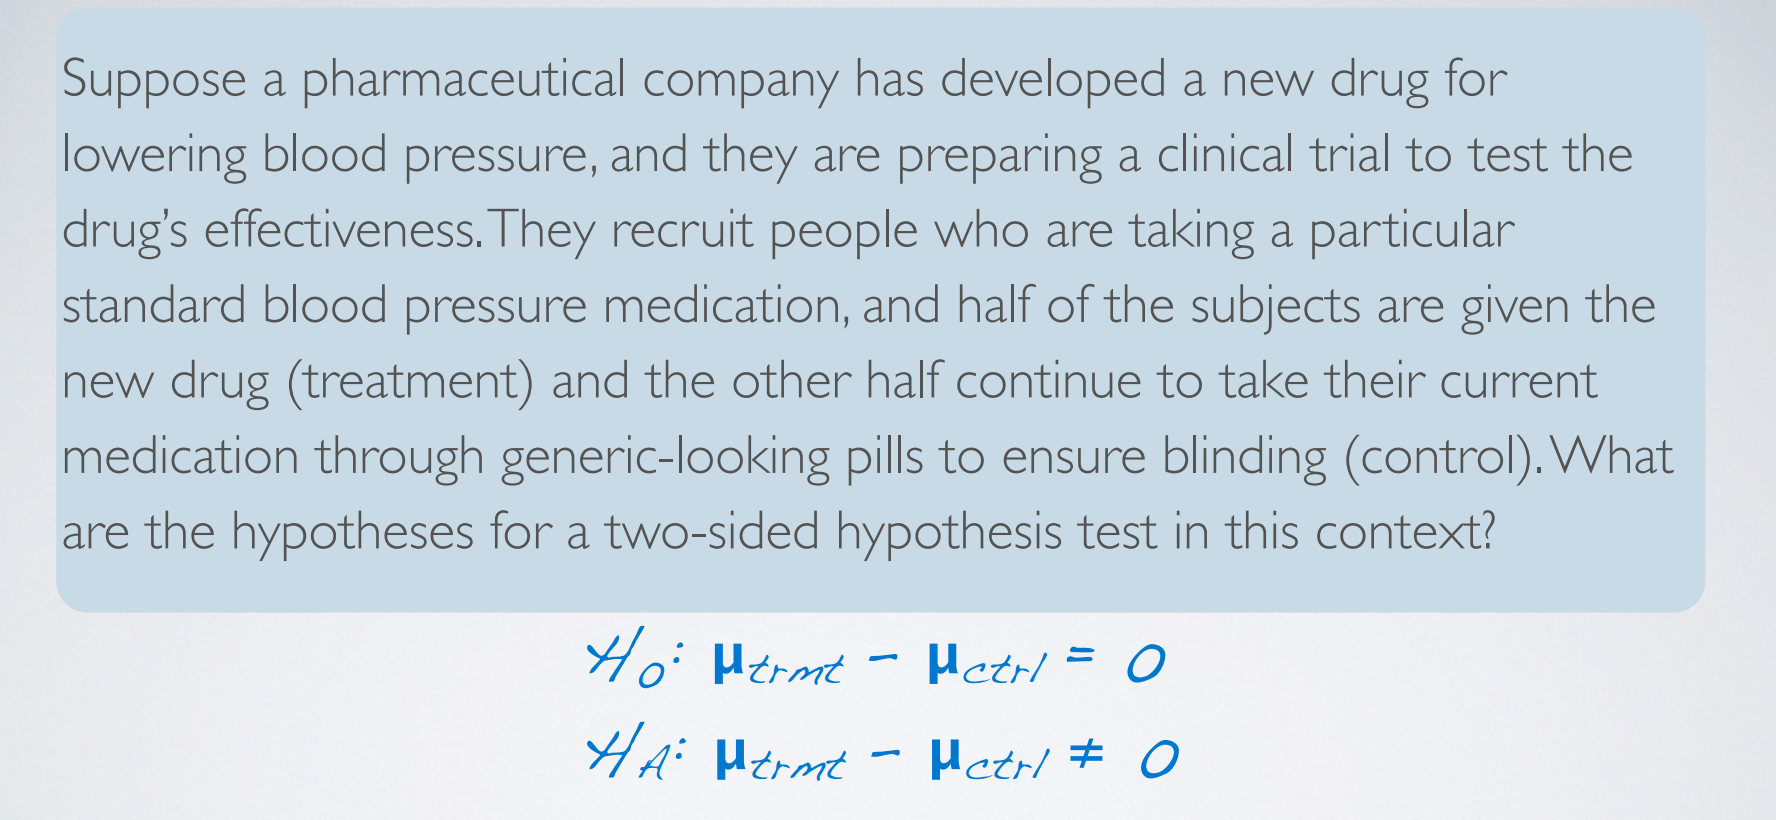
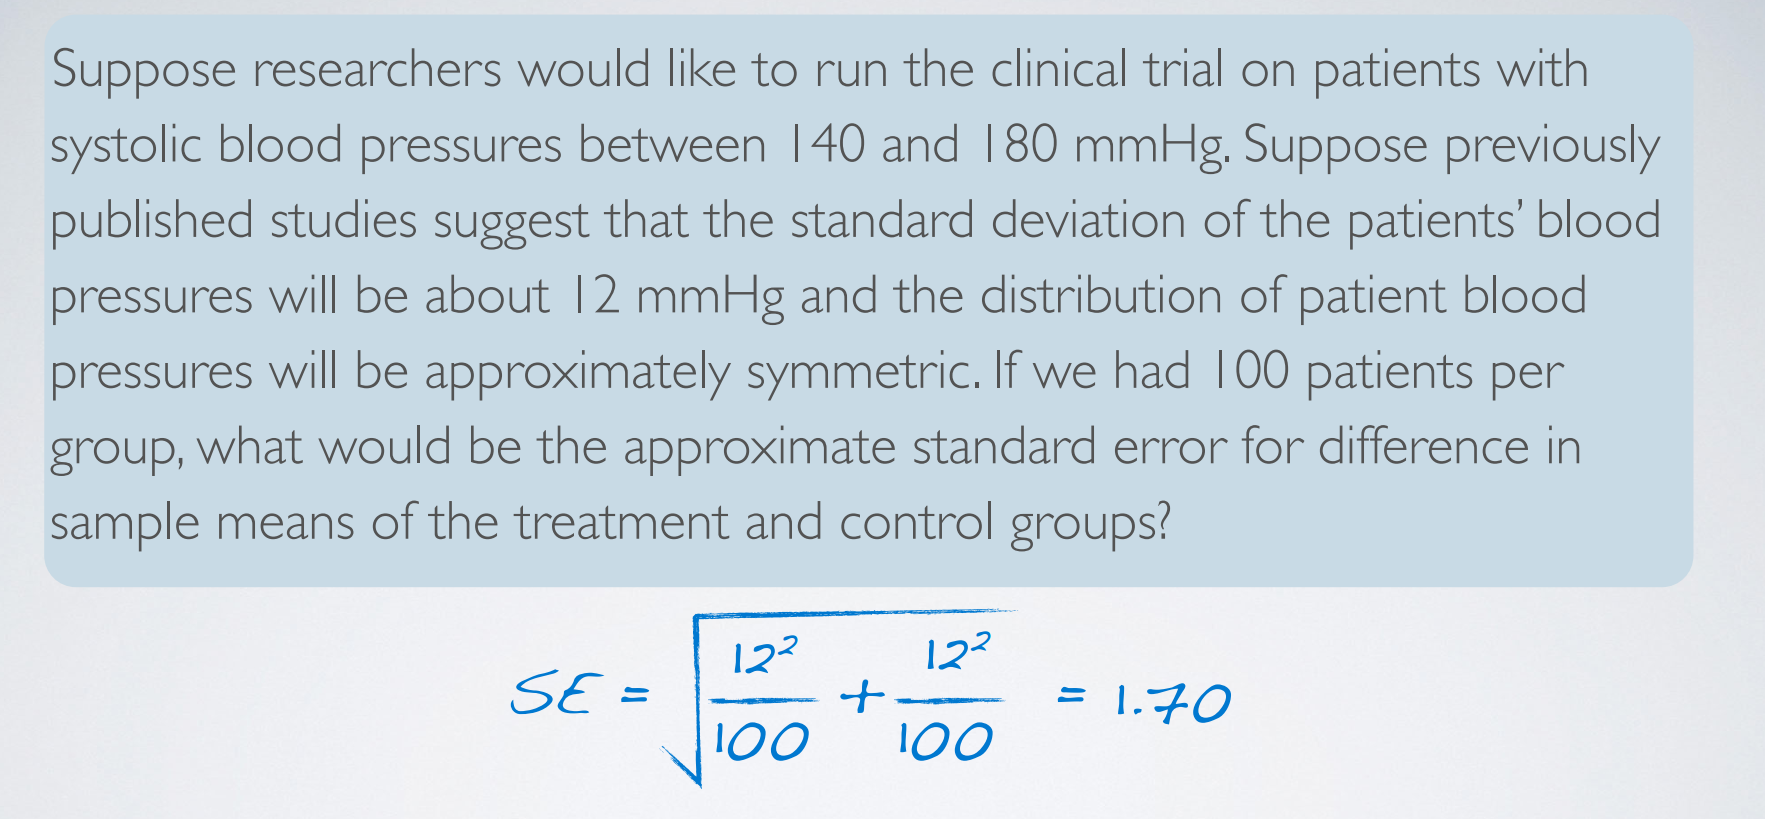
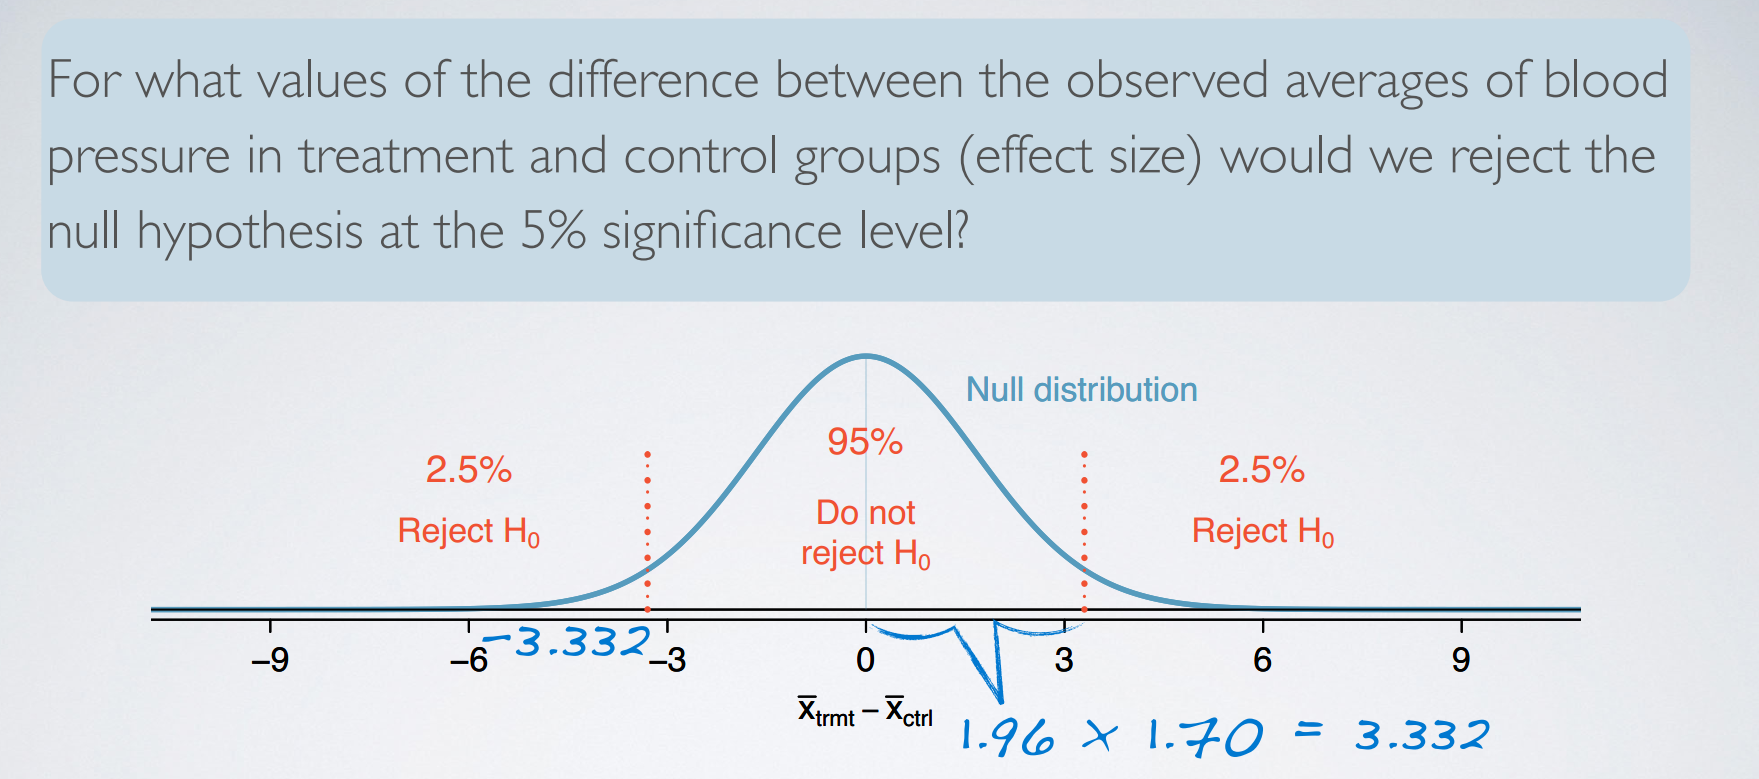
4. inference for comparing two indepenedent means
和上面一样的题目。
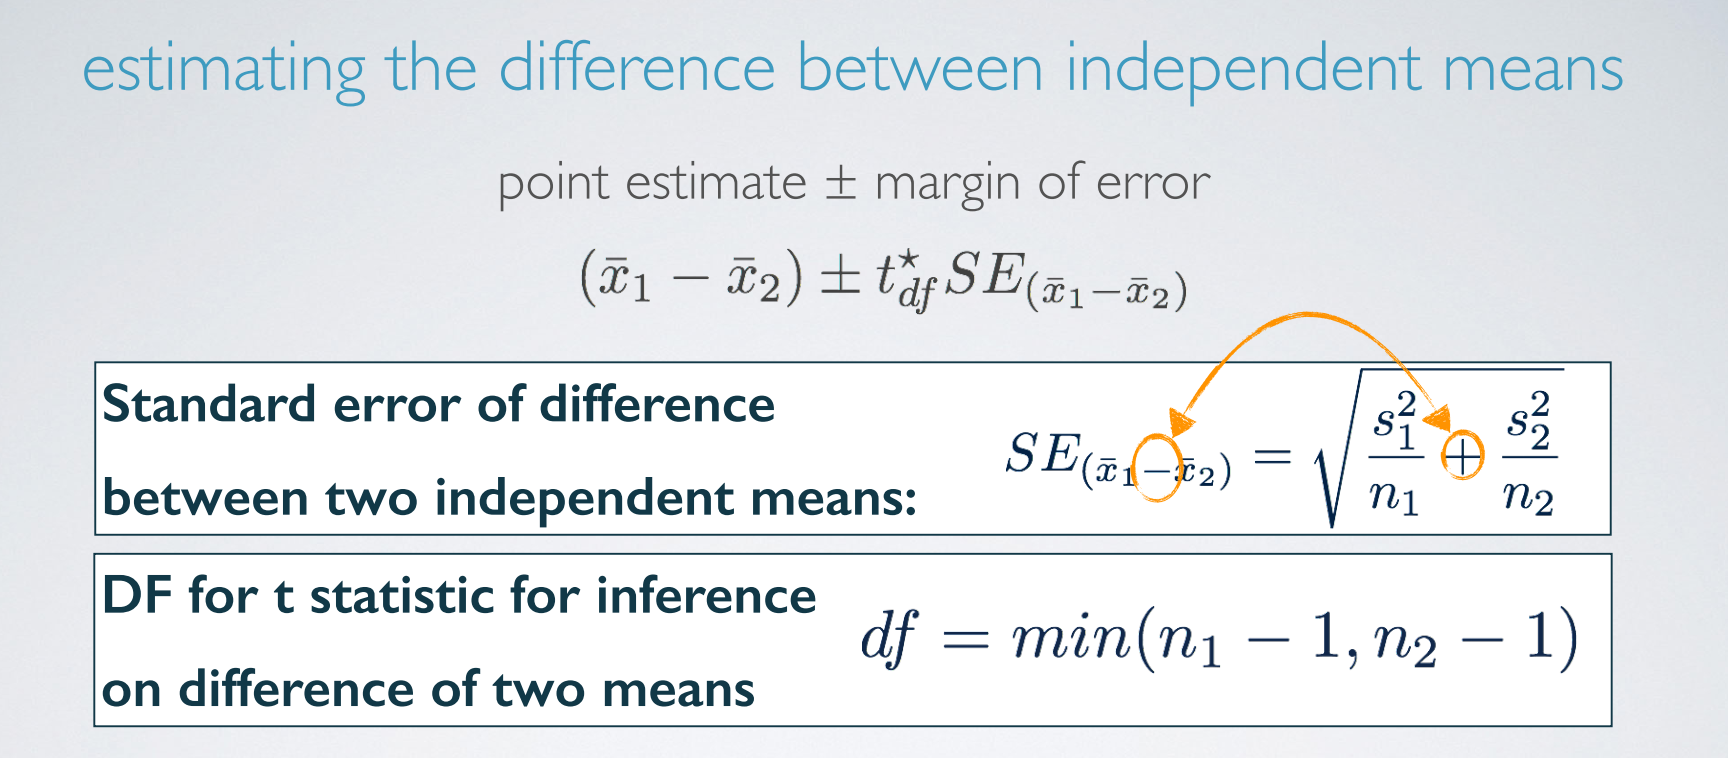
df和standard error的算法都有不同。
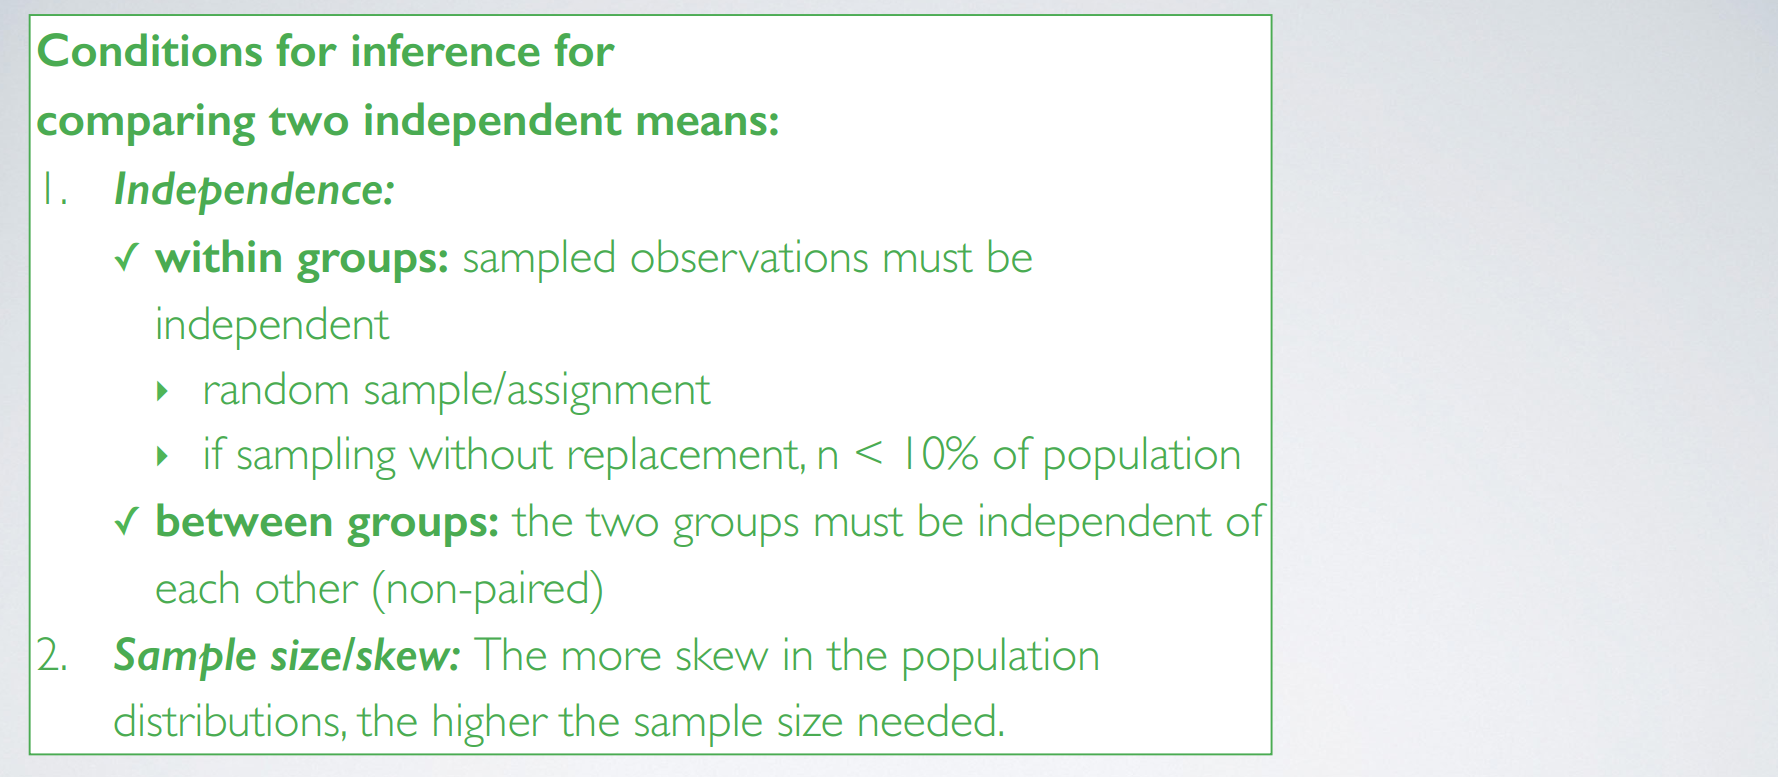
condition
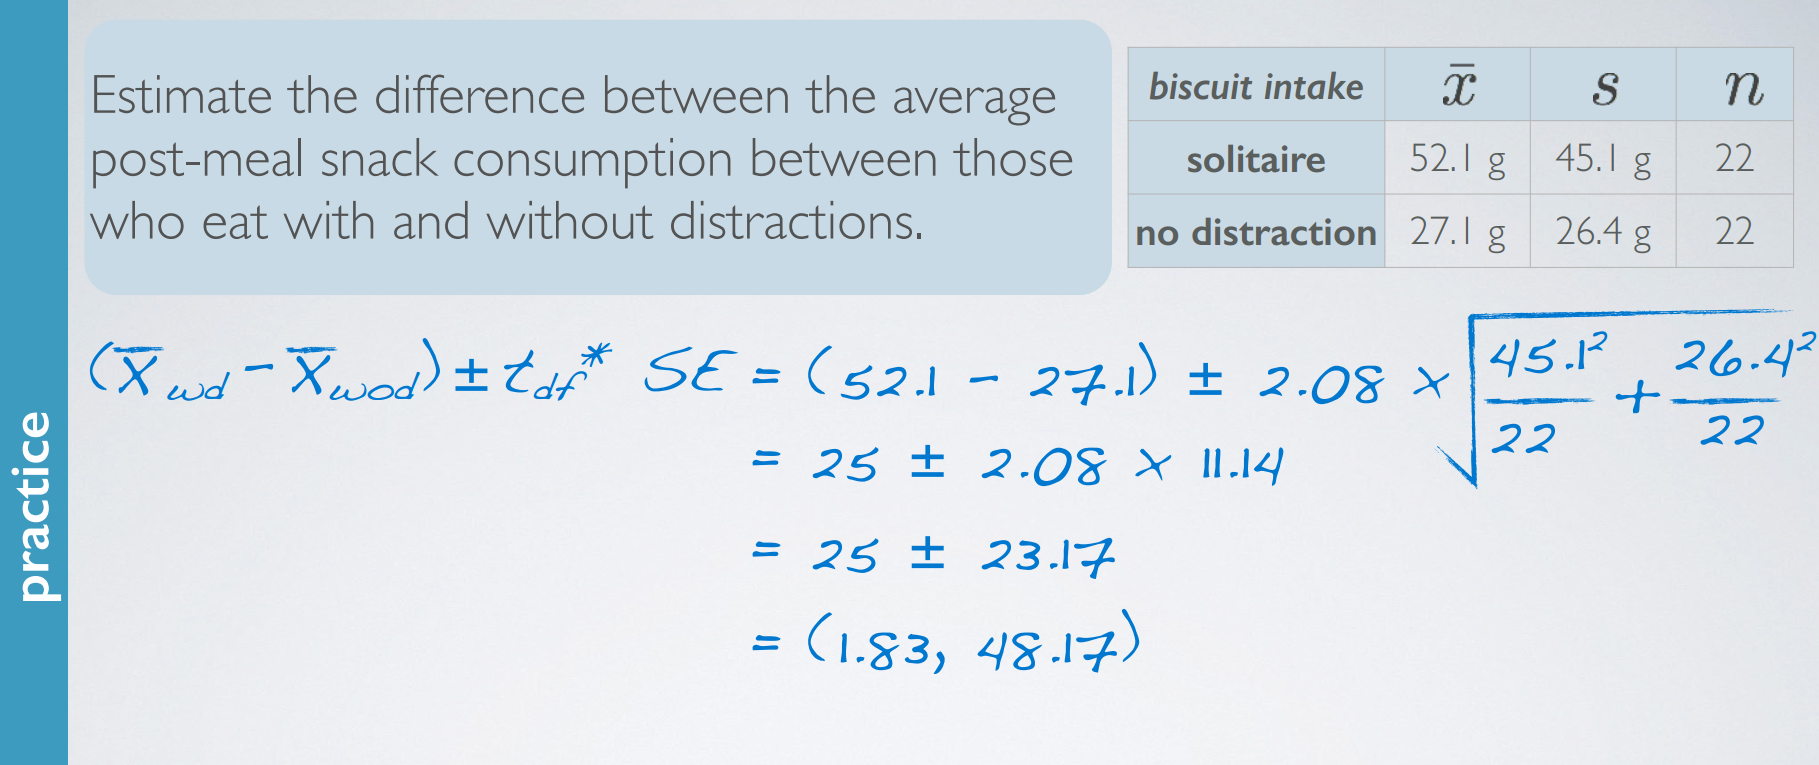
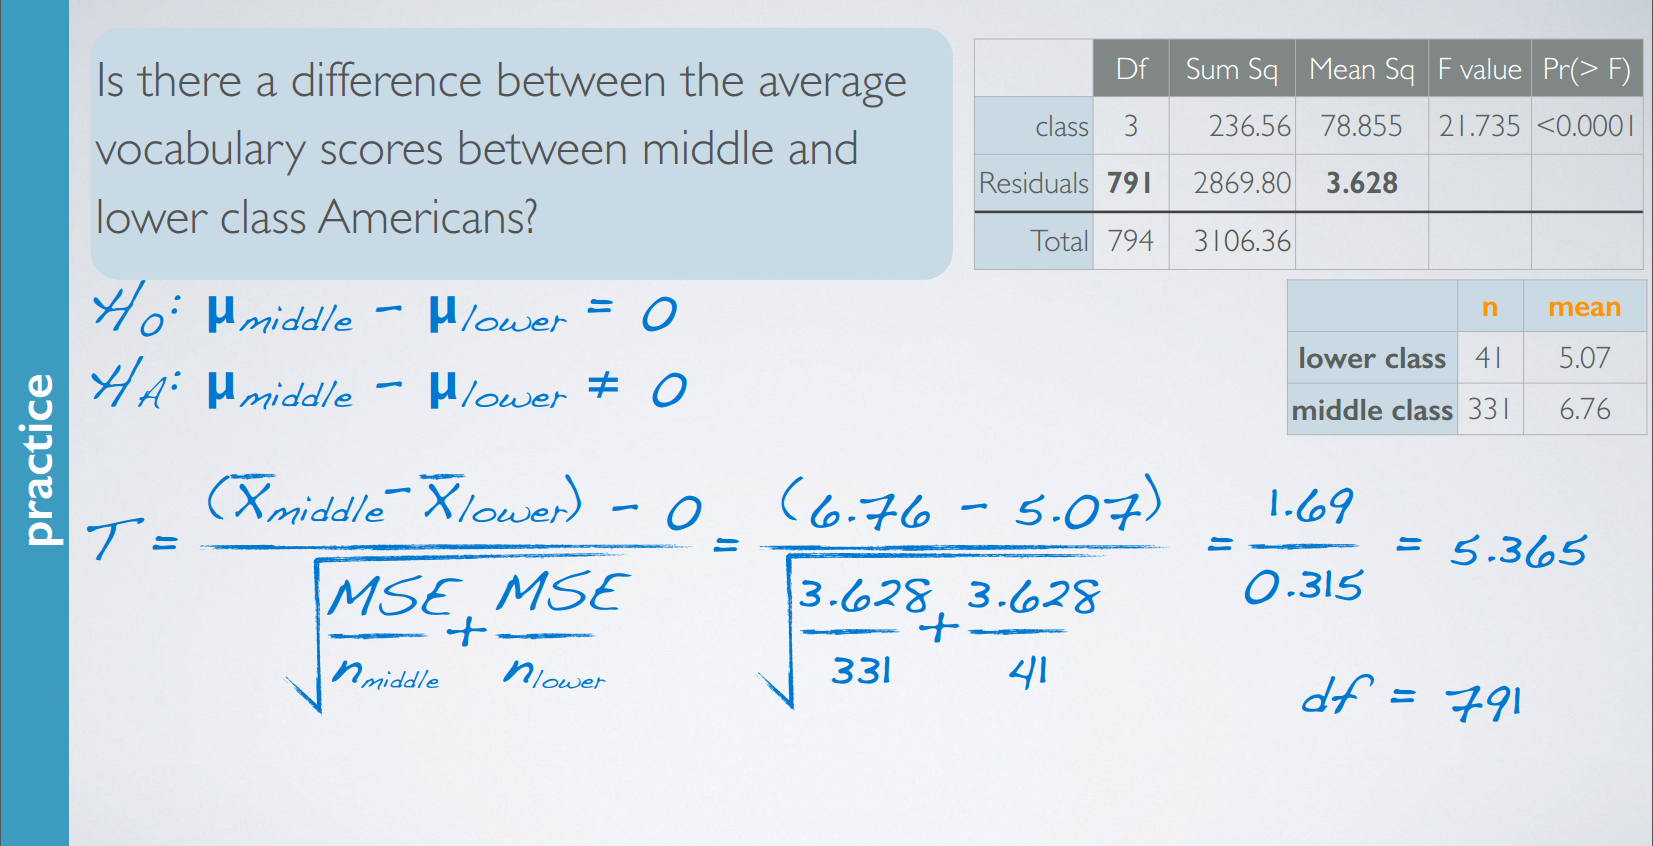
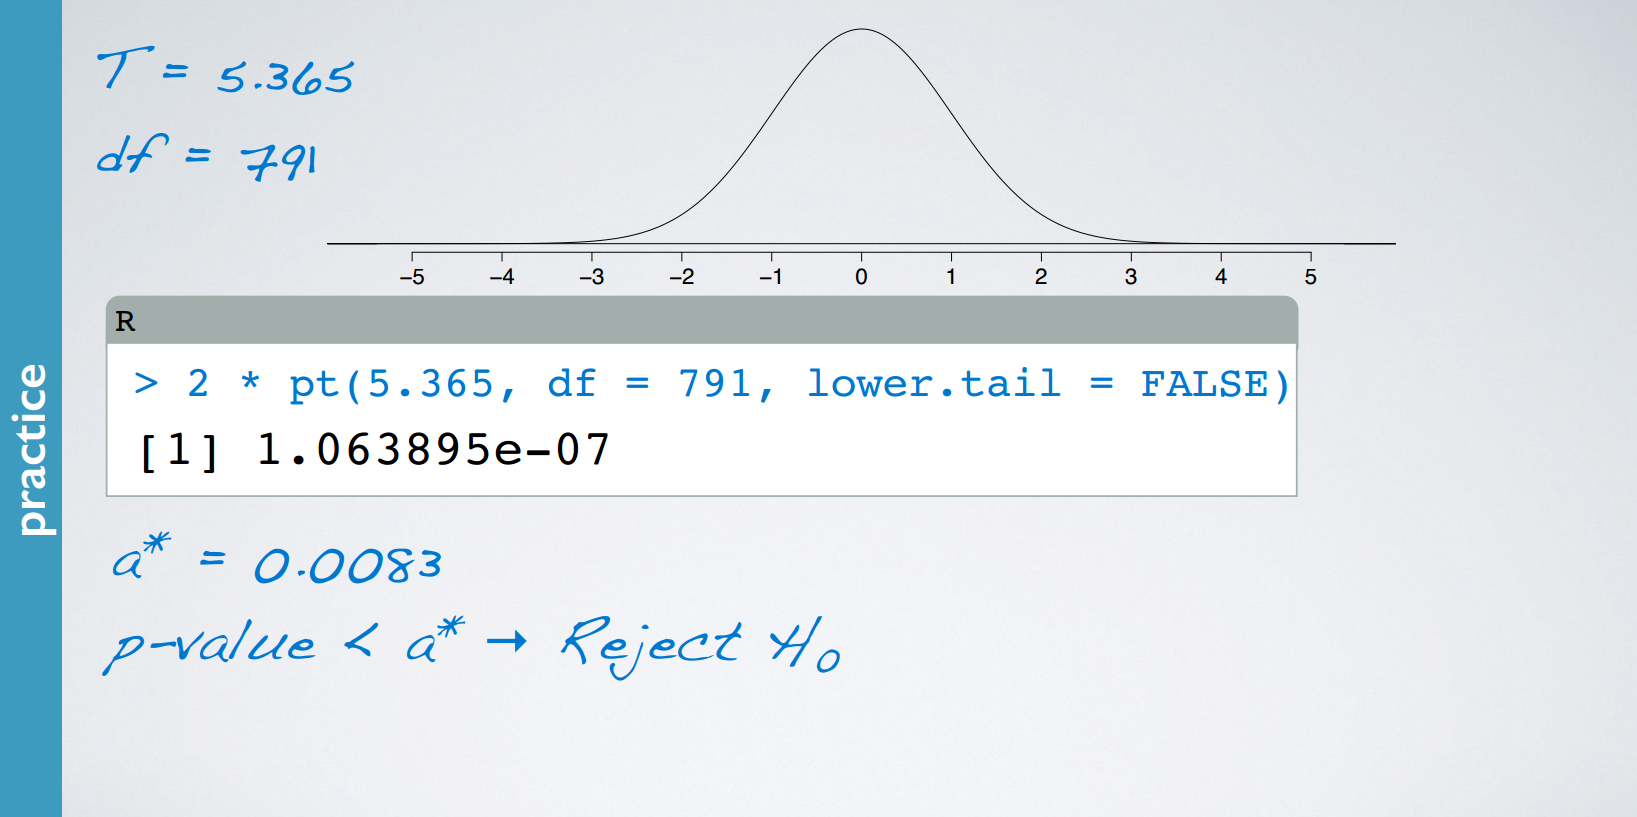
practice
recap

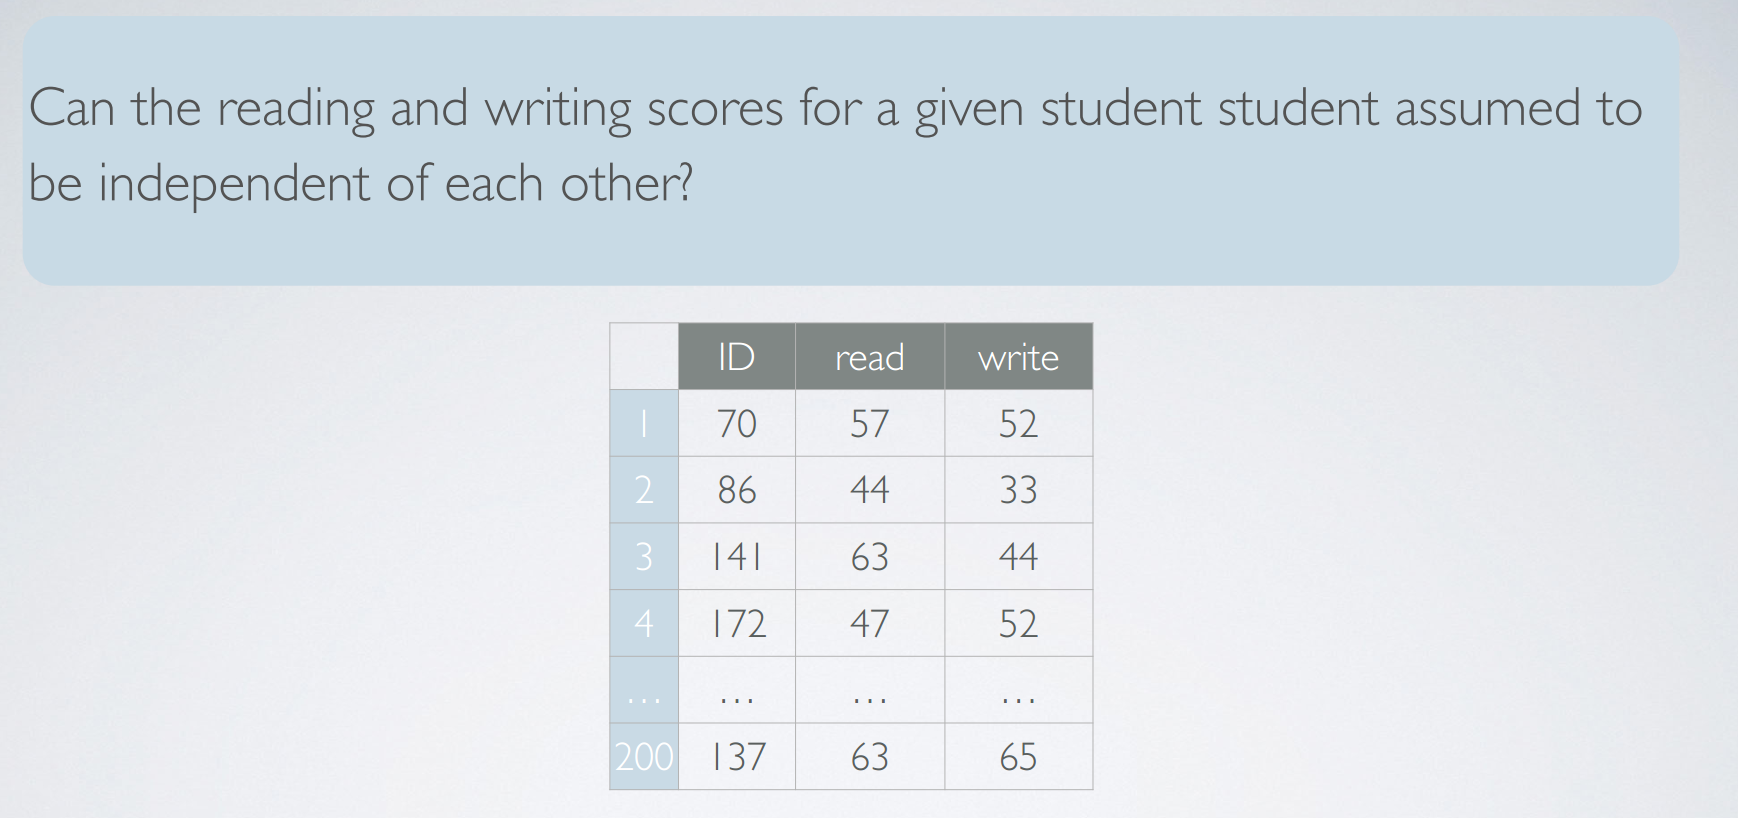
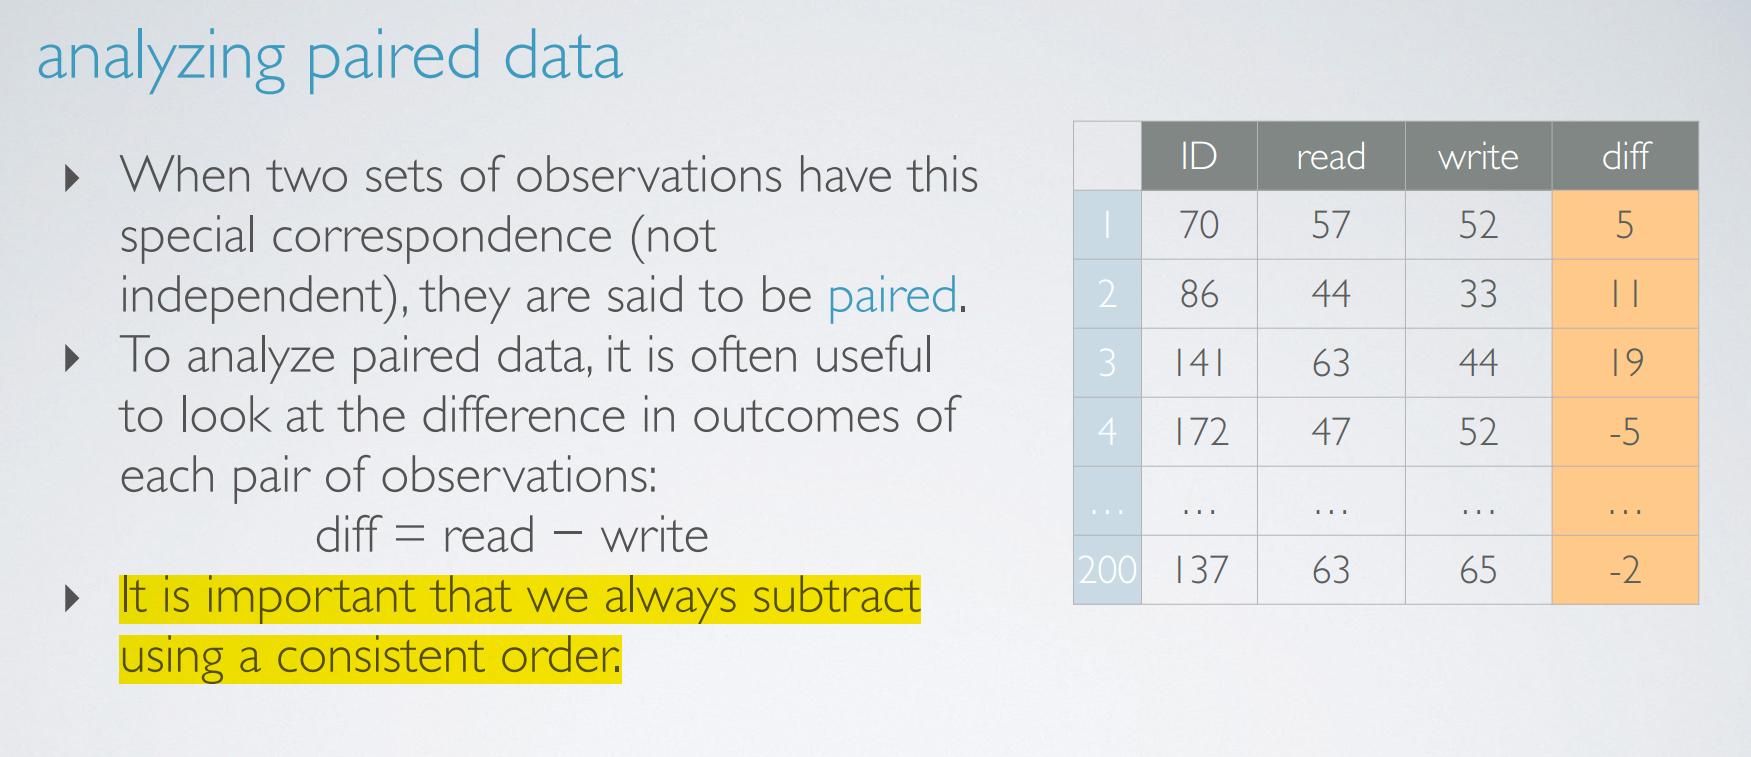
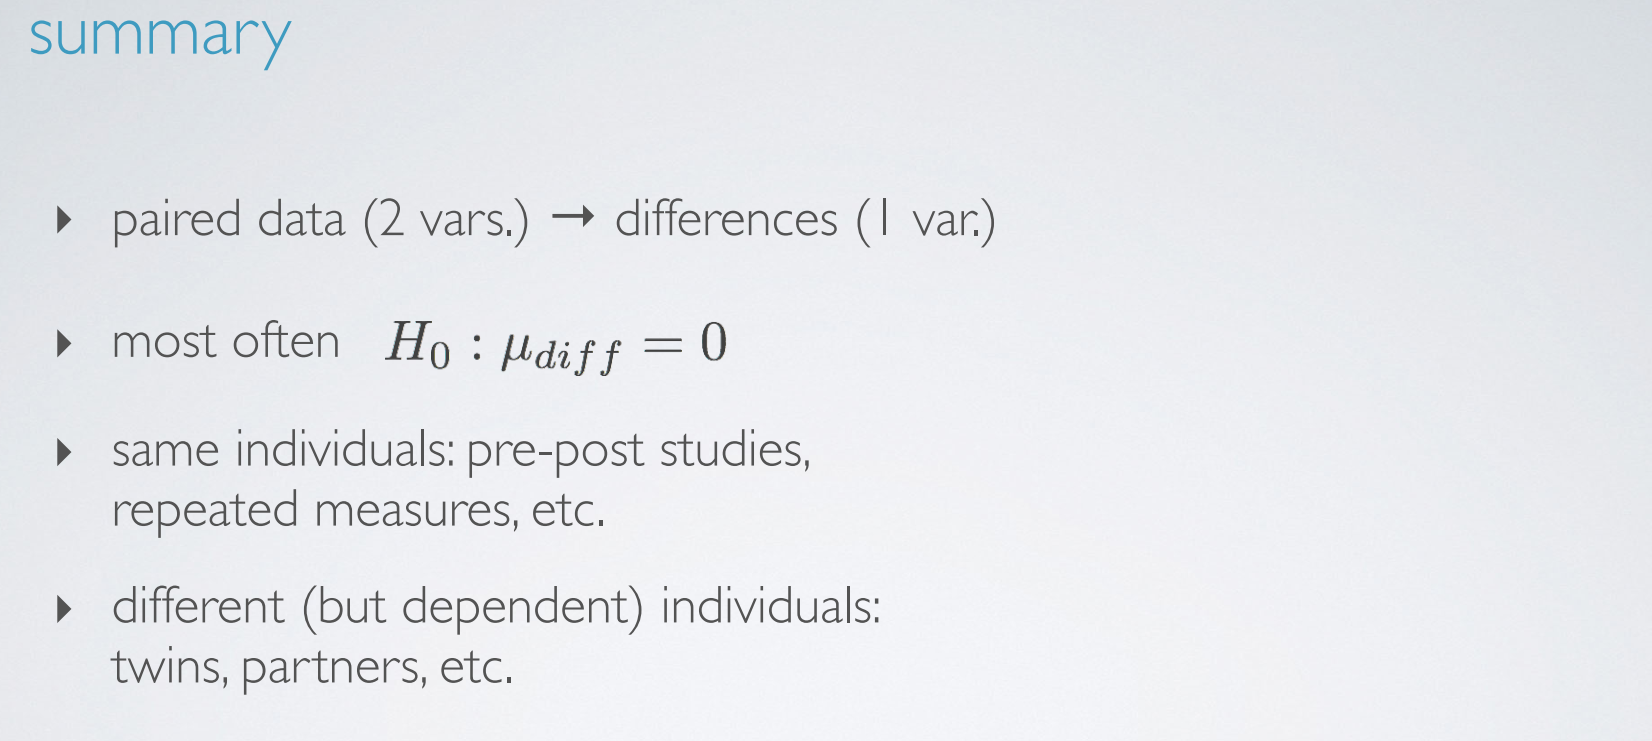
5. inference for comparing two paired means
In this video, we discuss how our methodology should change if the means we're comparing are paired, in other words, dependent.
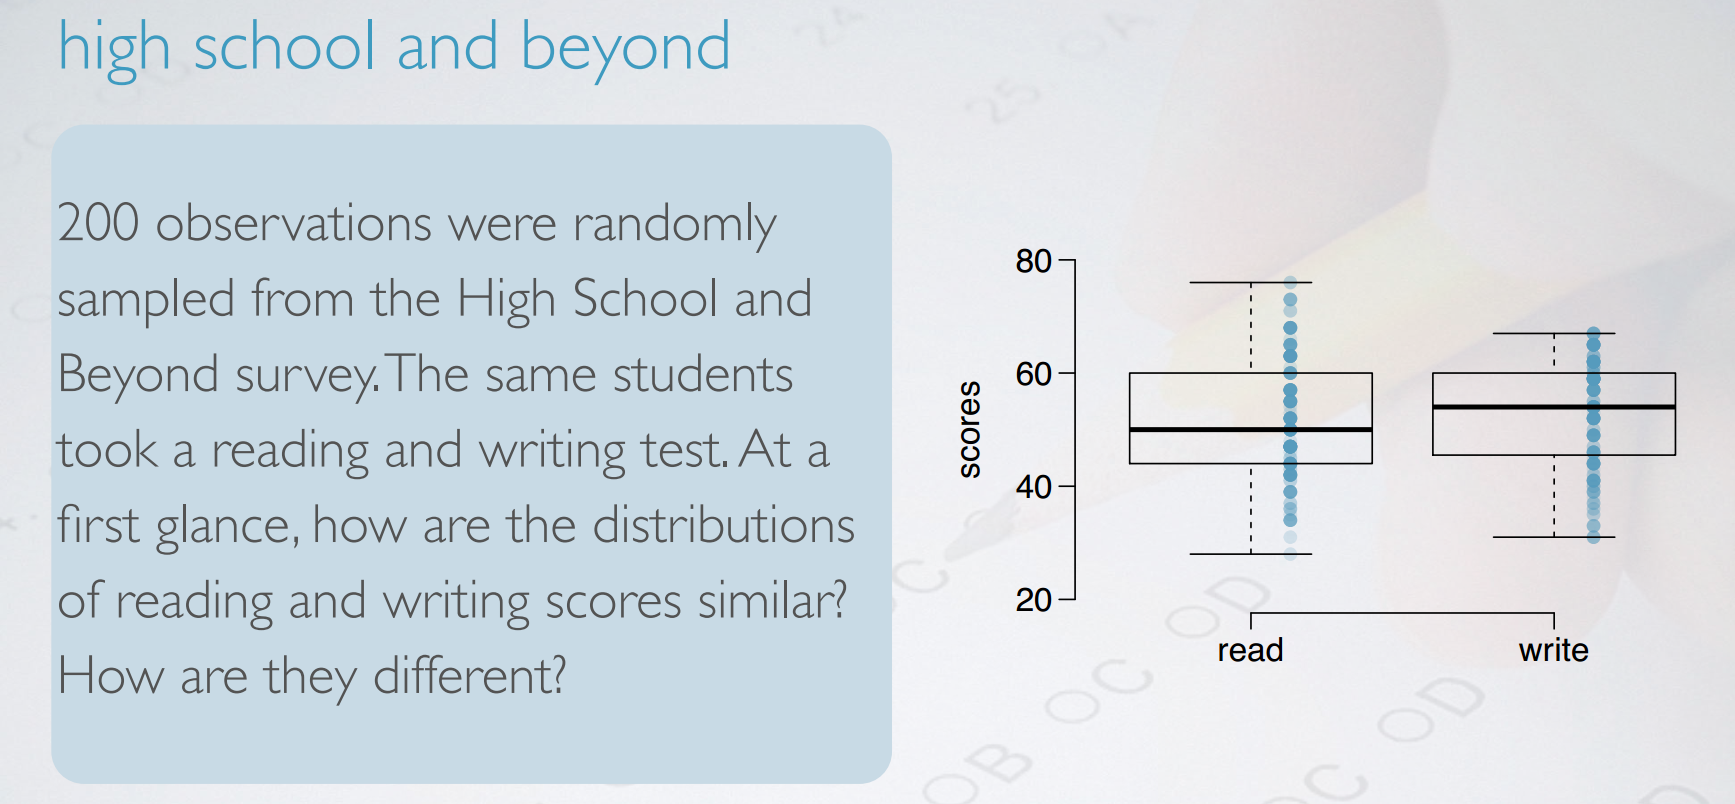
high school and beyond
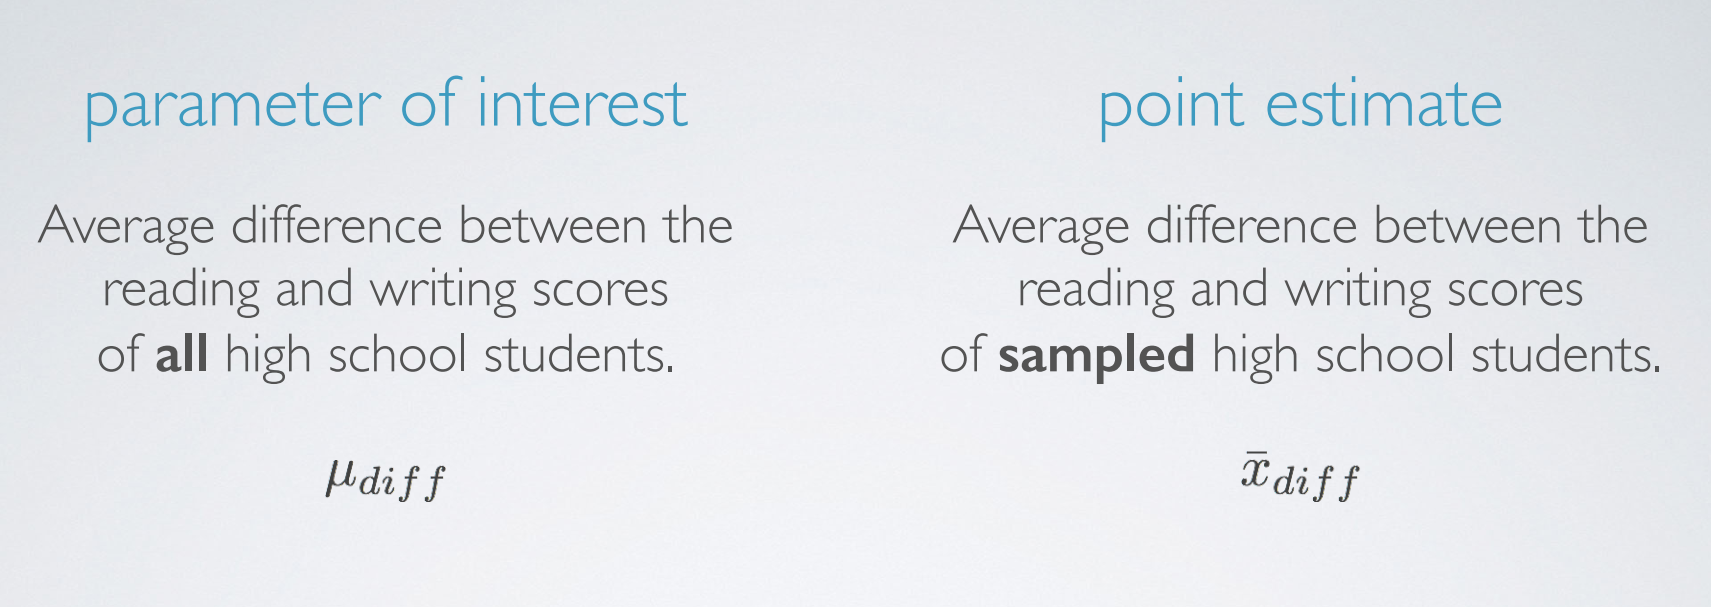

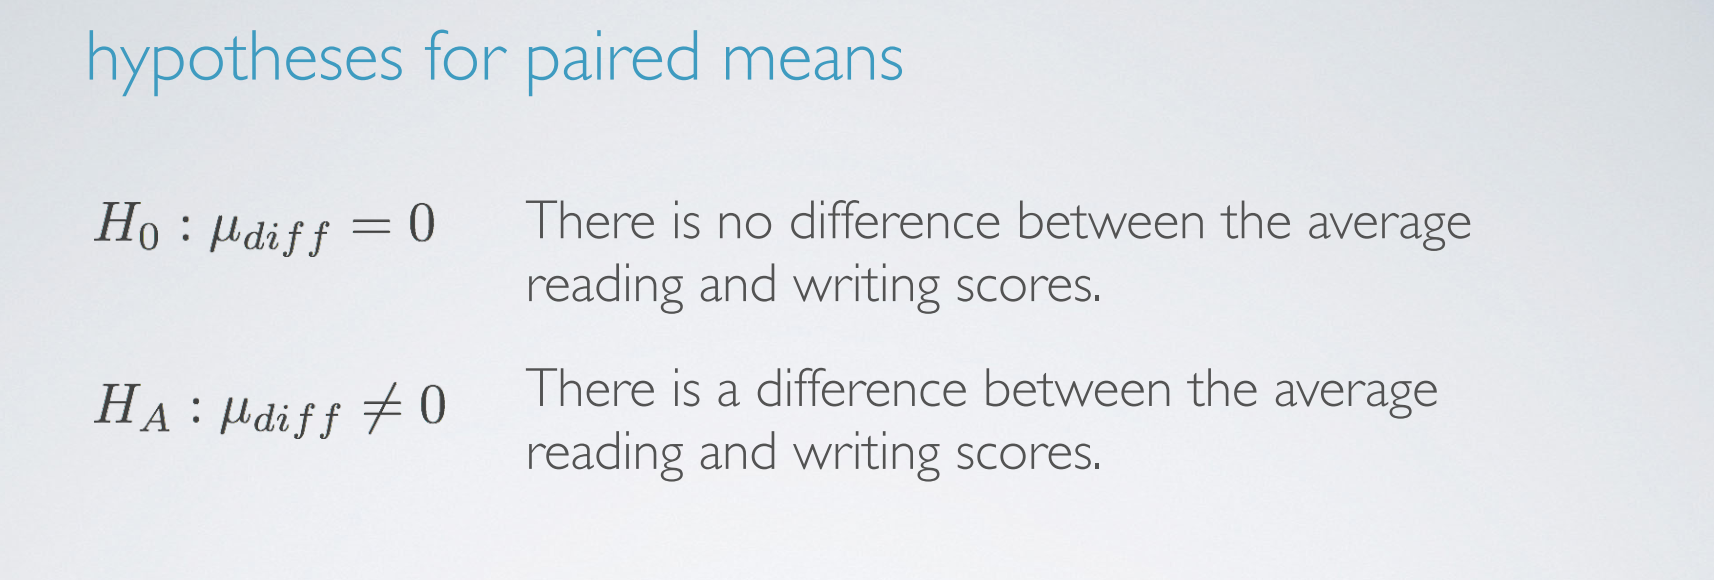
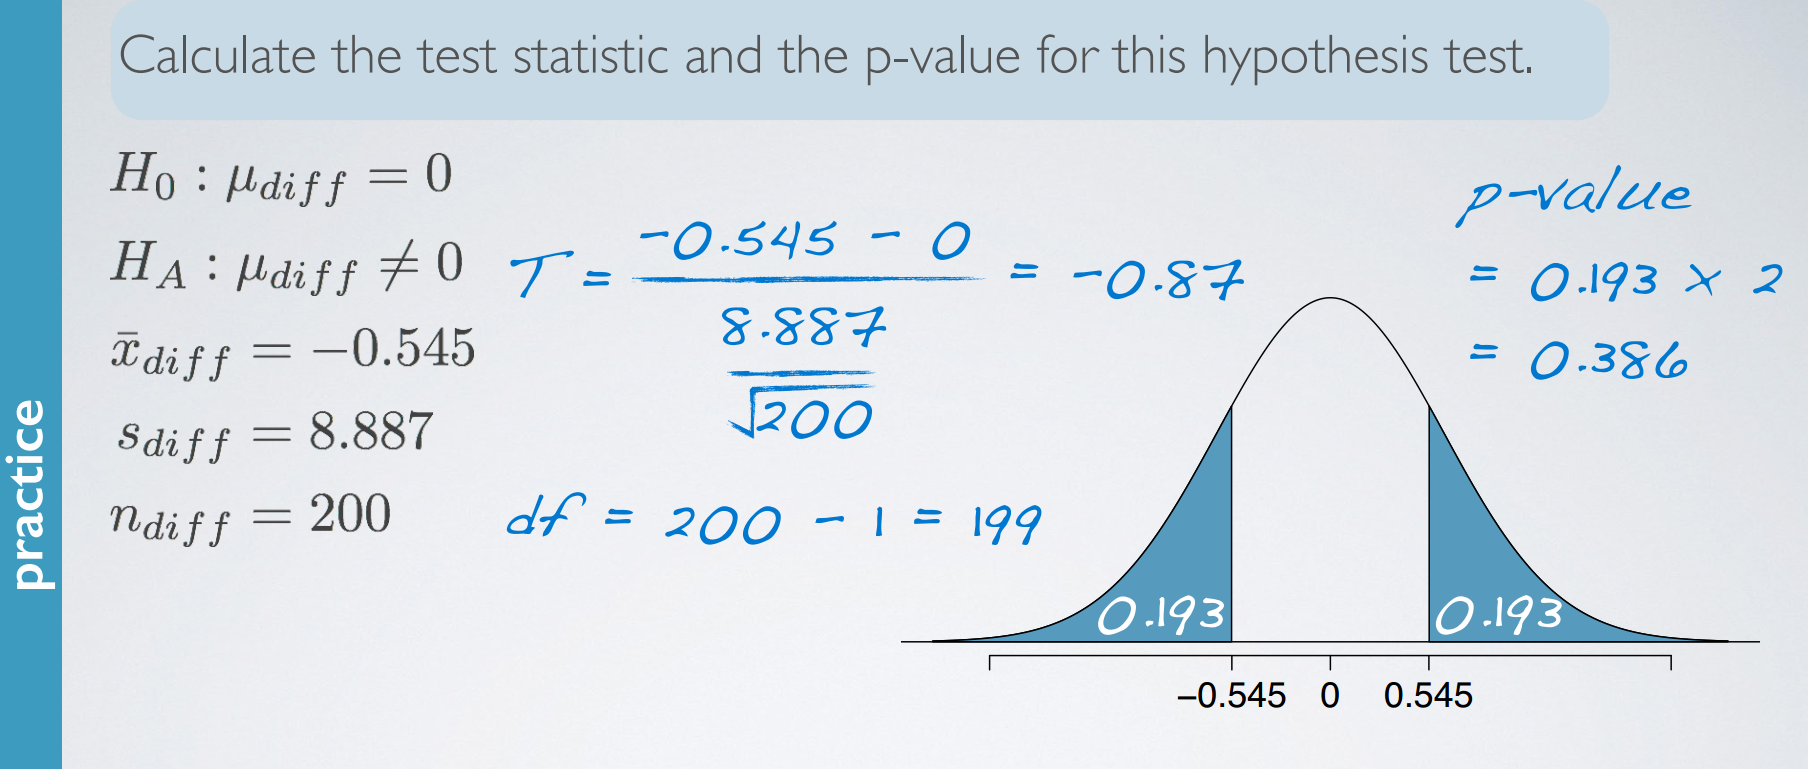
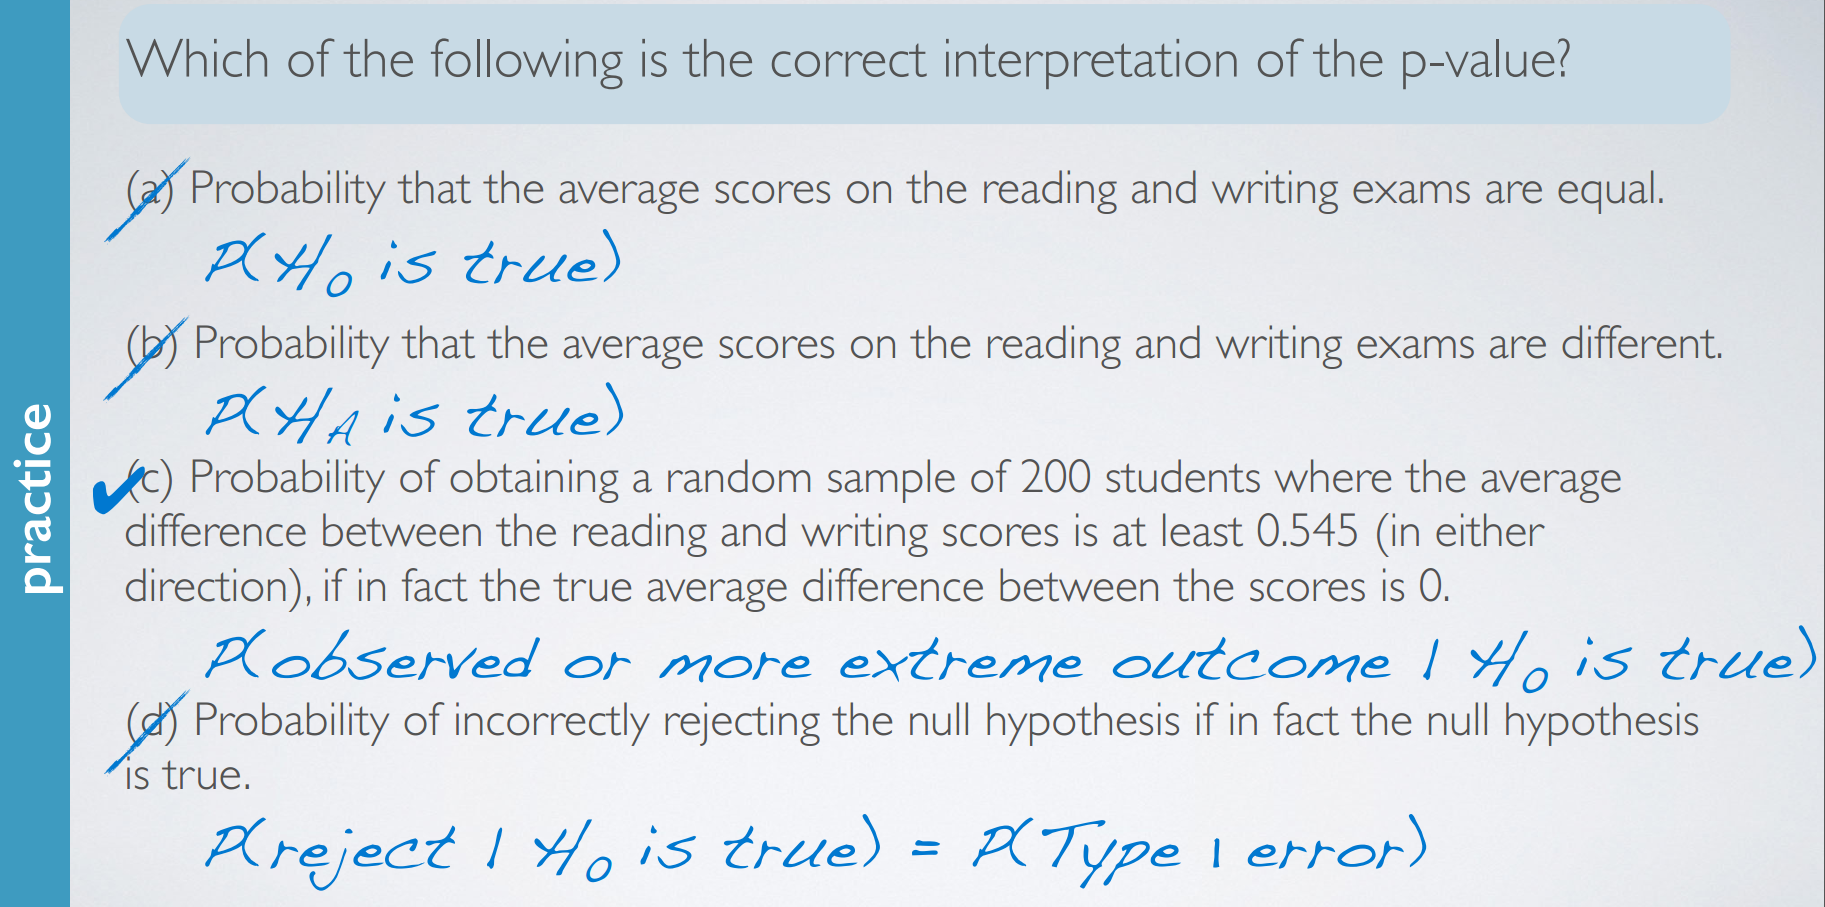
hypotheses for paired means
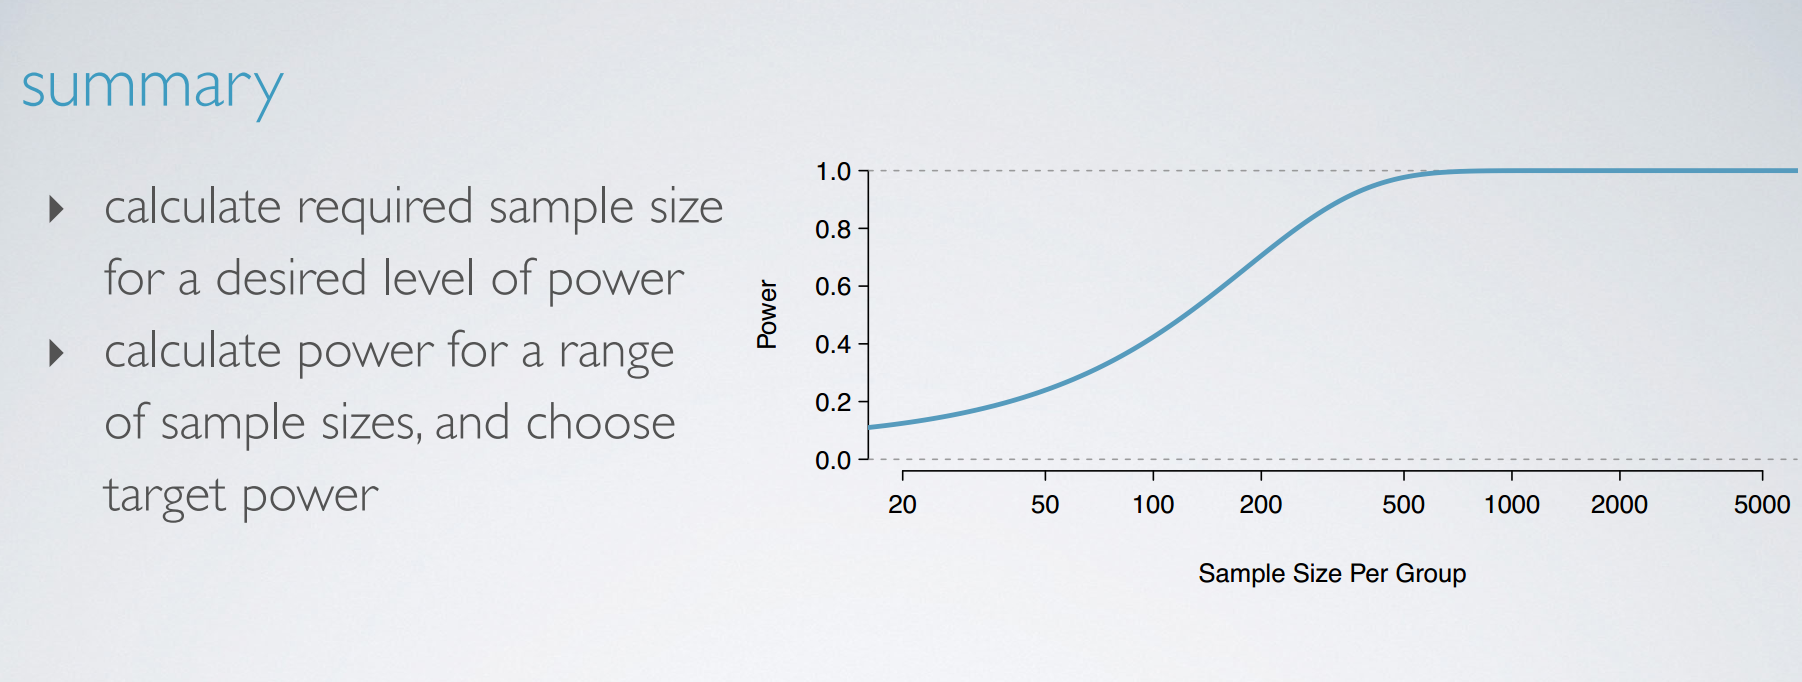
summary
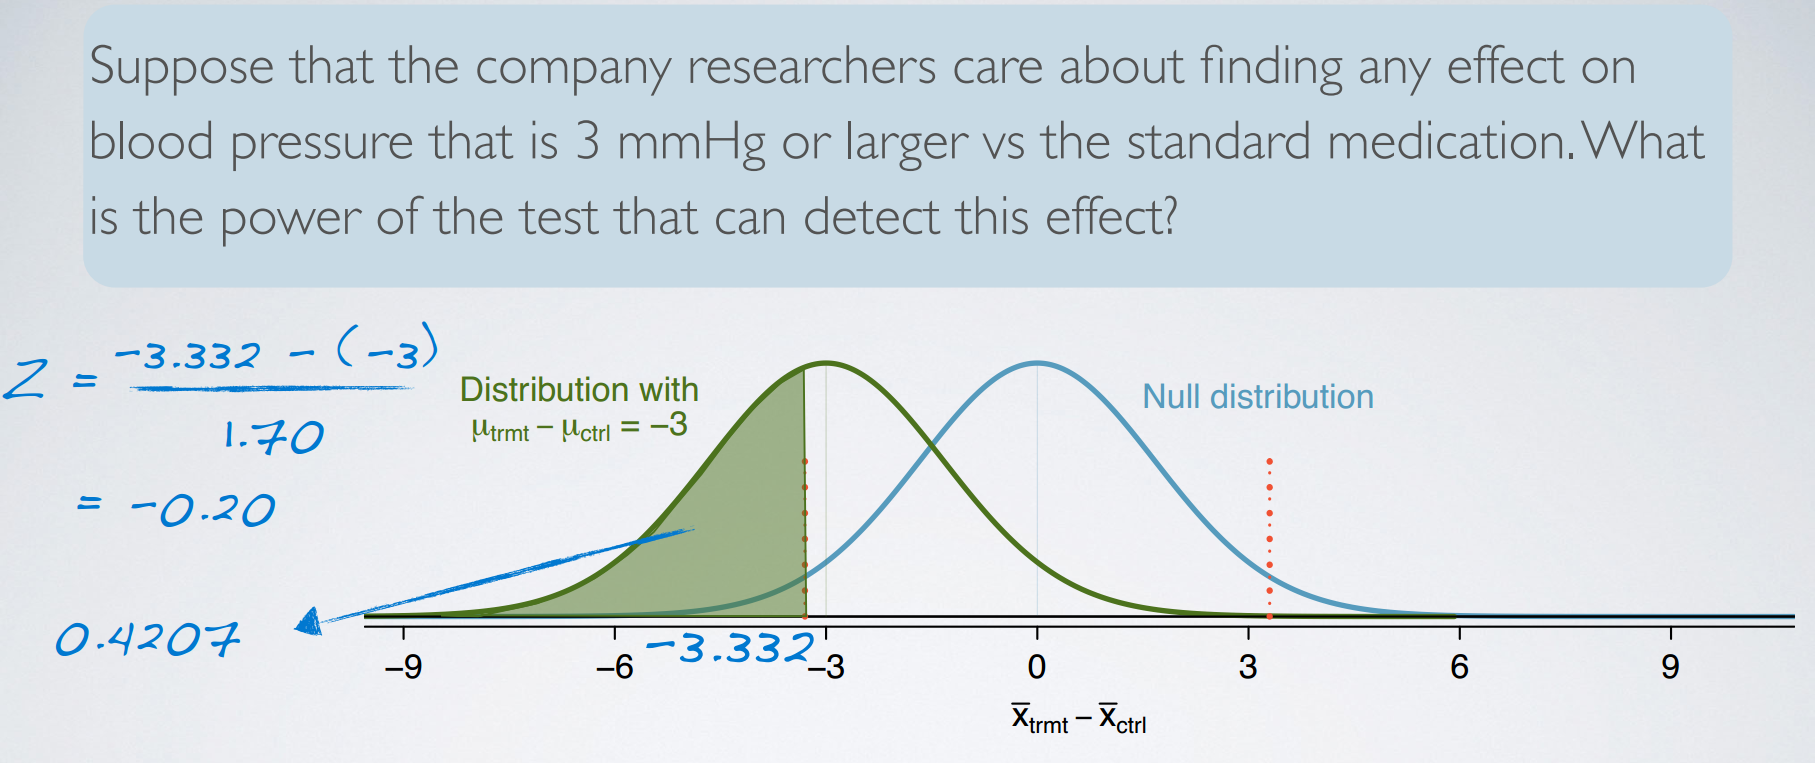
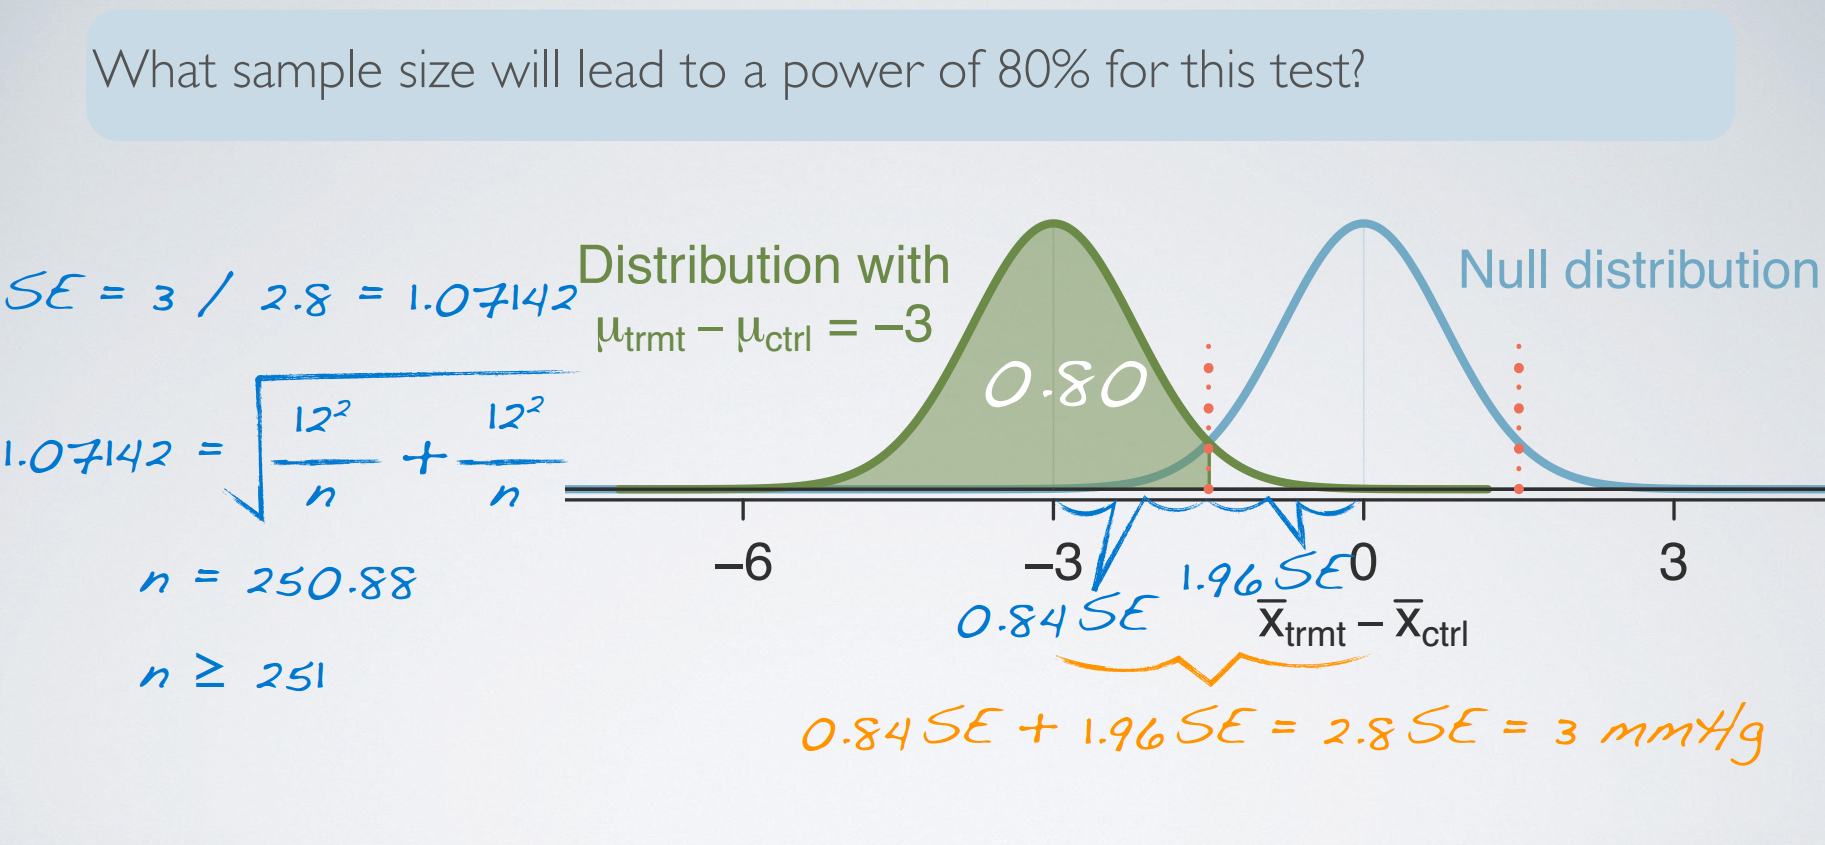
6. Power
Power

ANOVA and bootstrapping
1. comparing more than two means
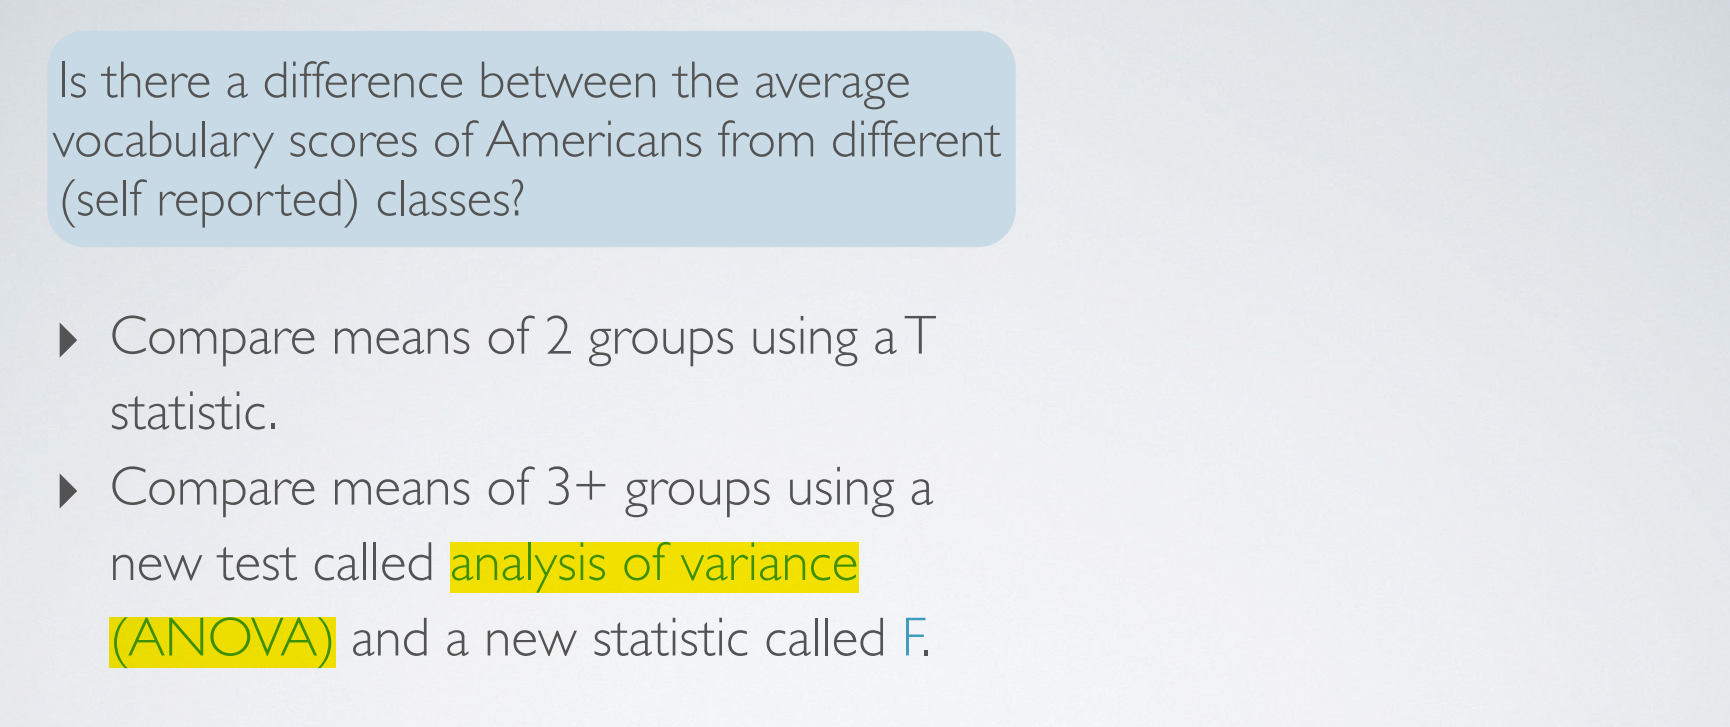

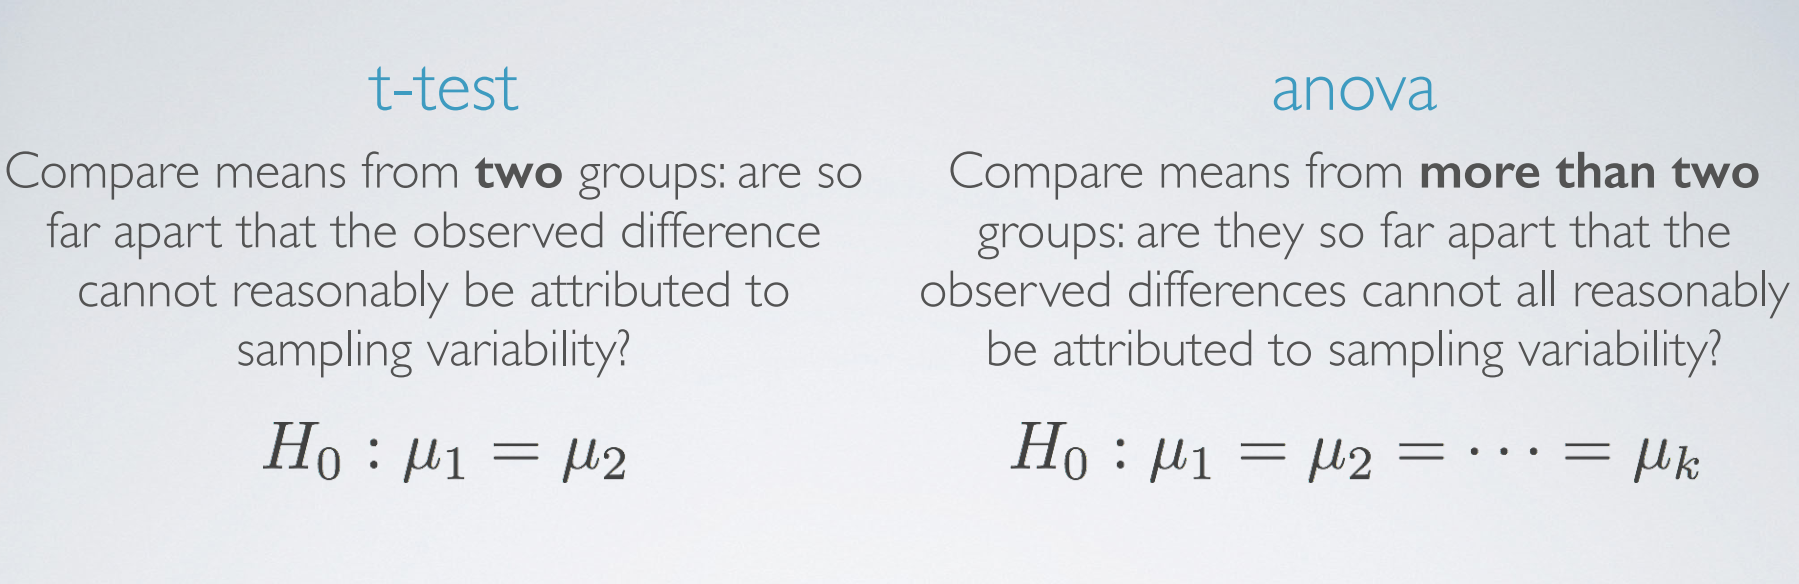
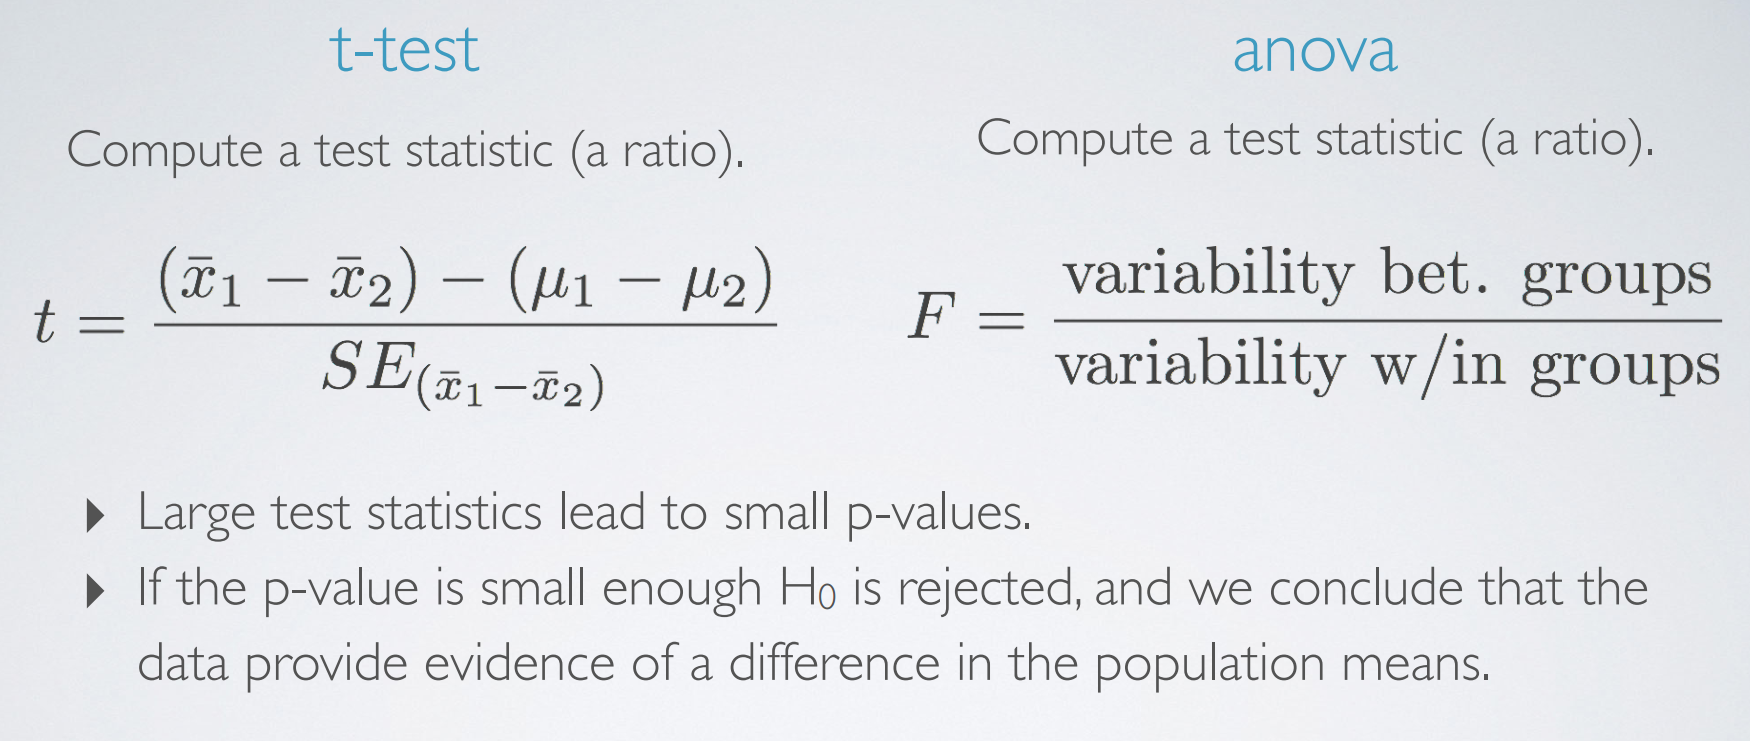
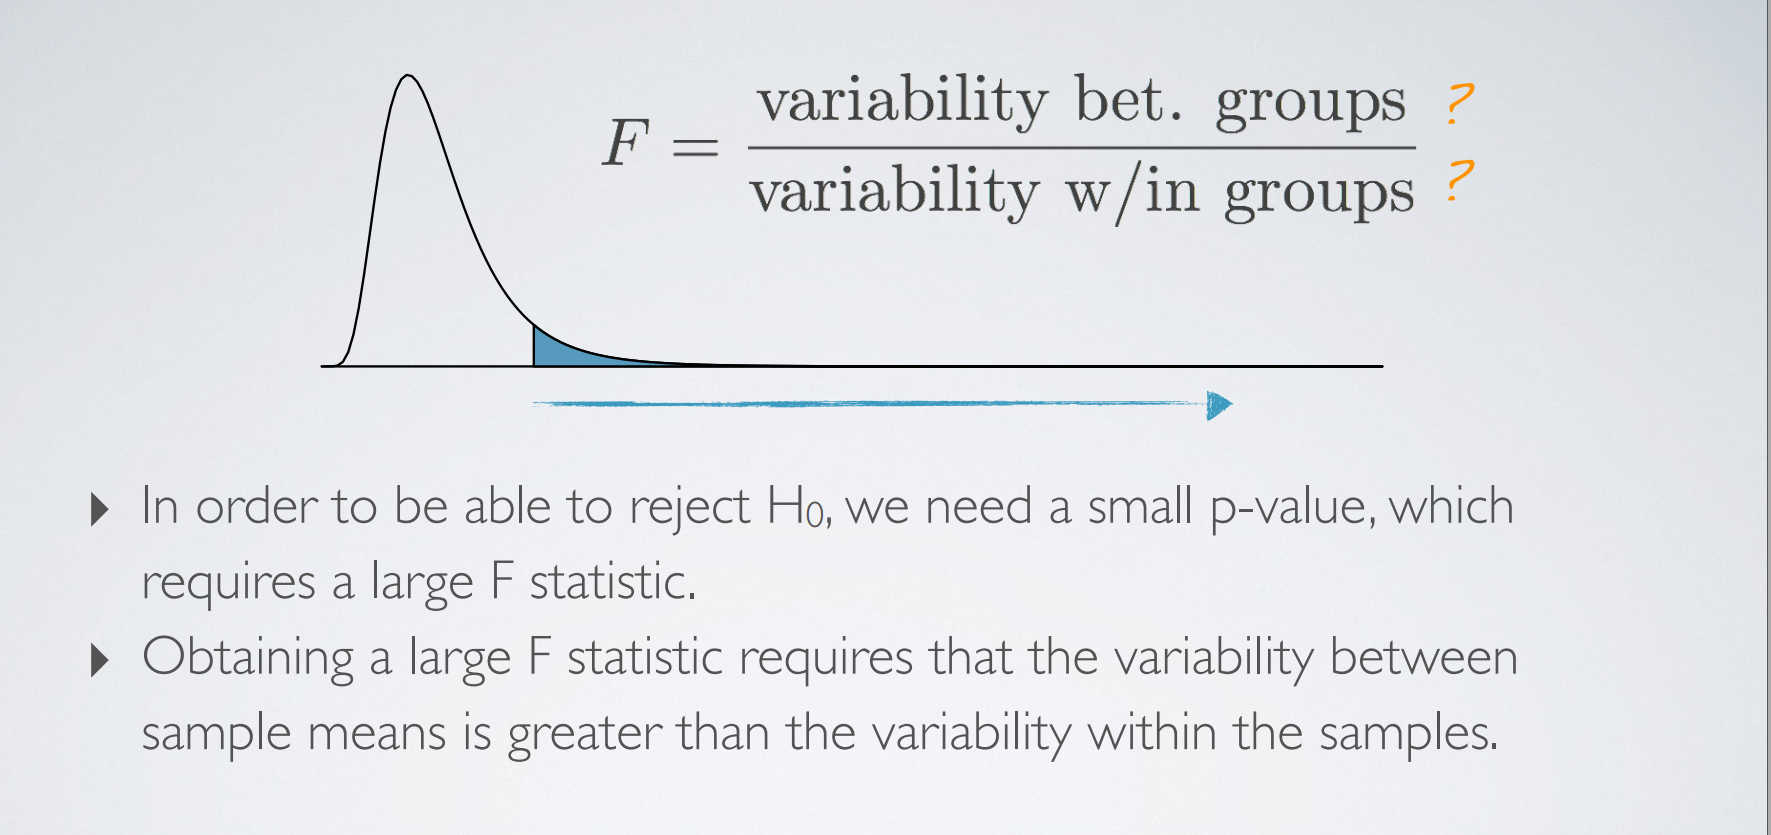
2. ANOVA
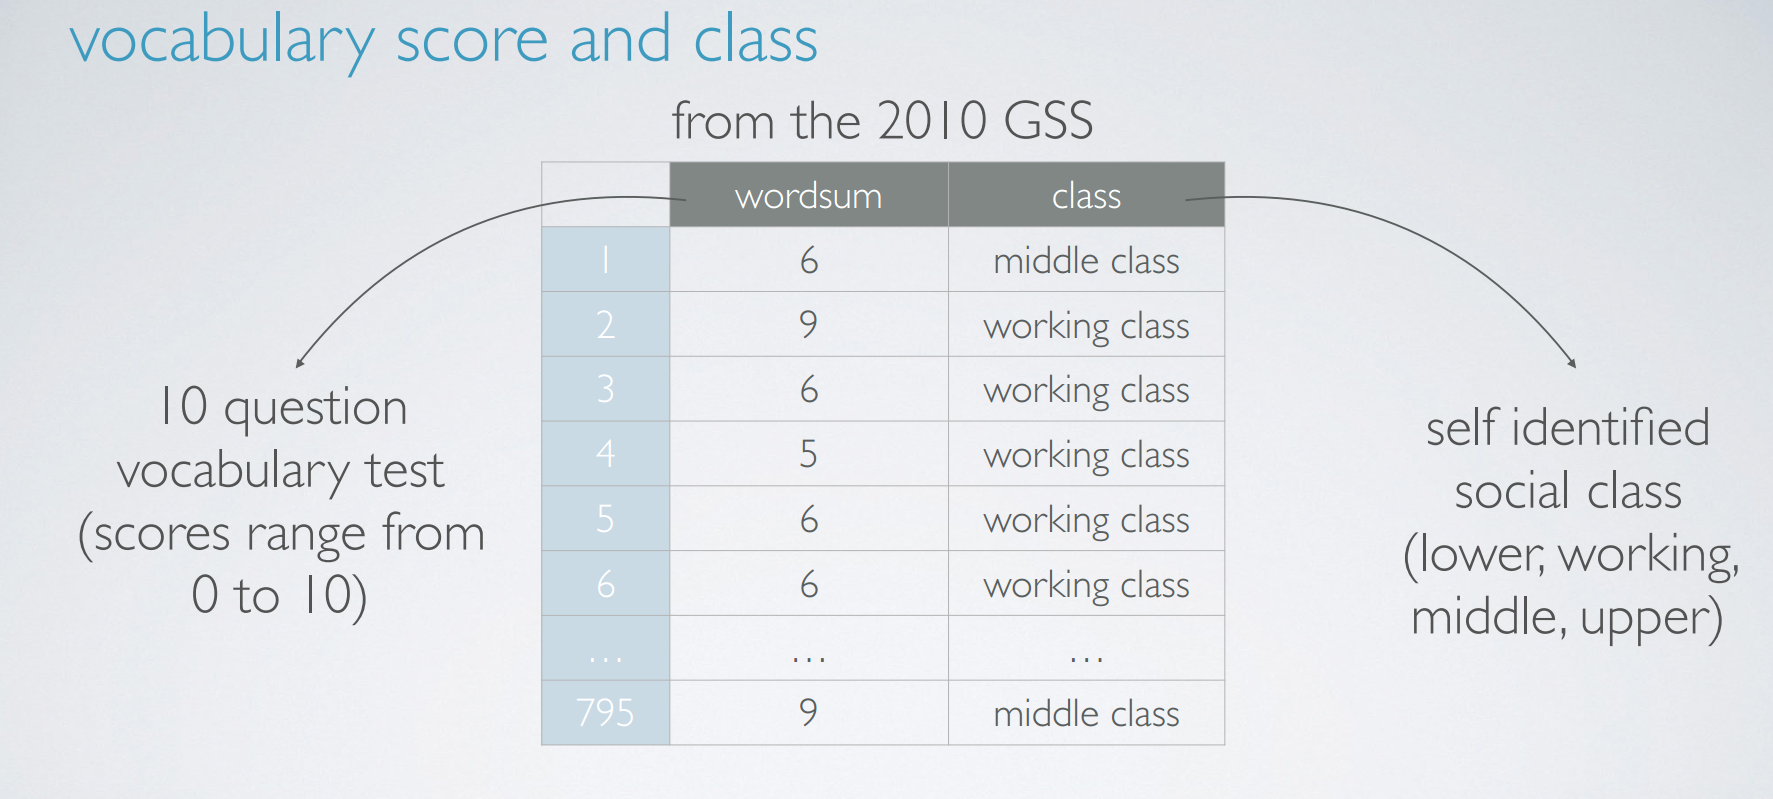
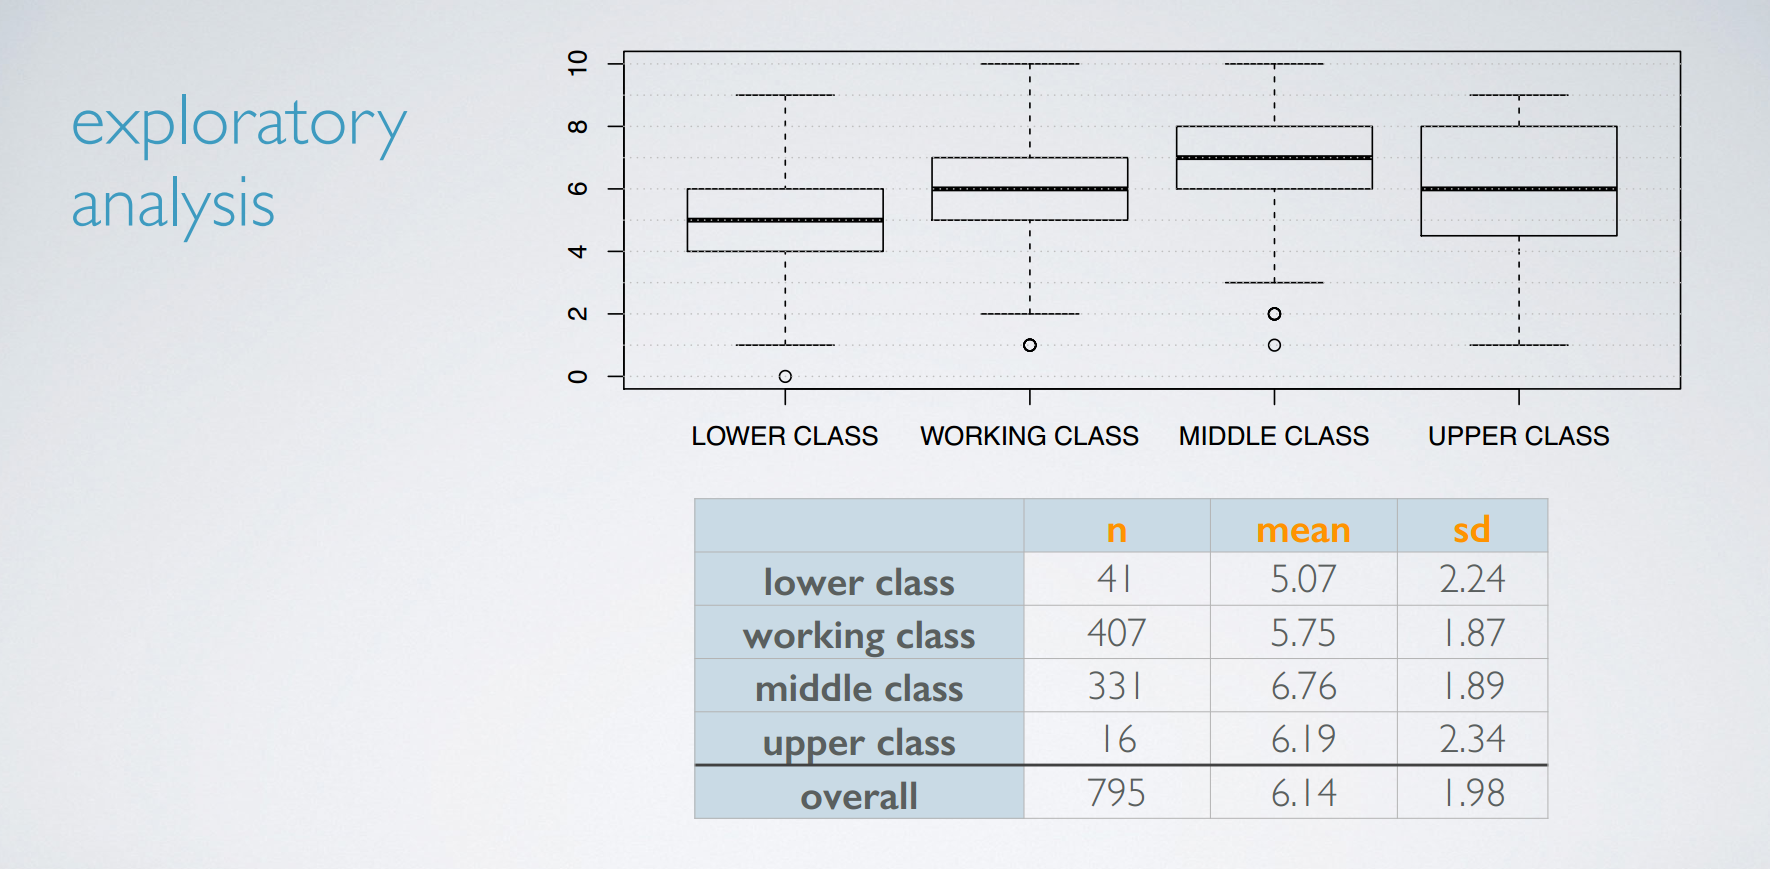
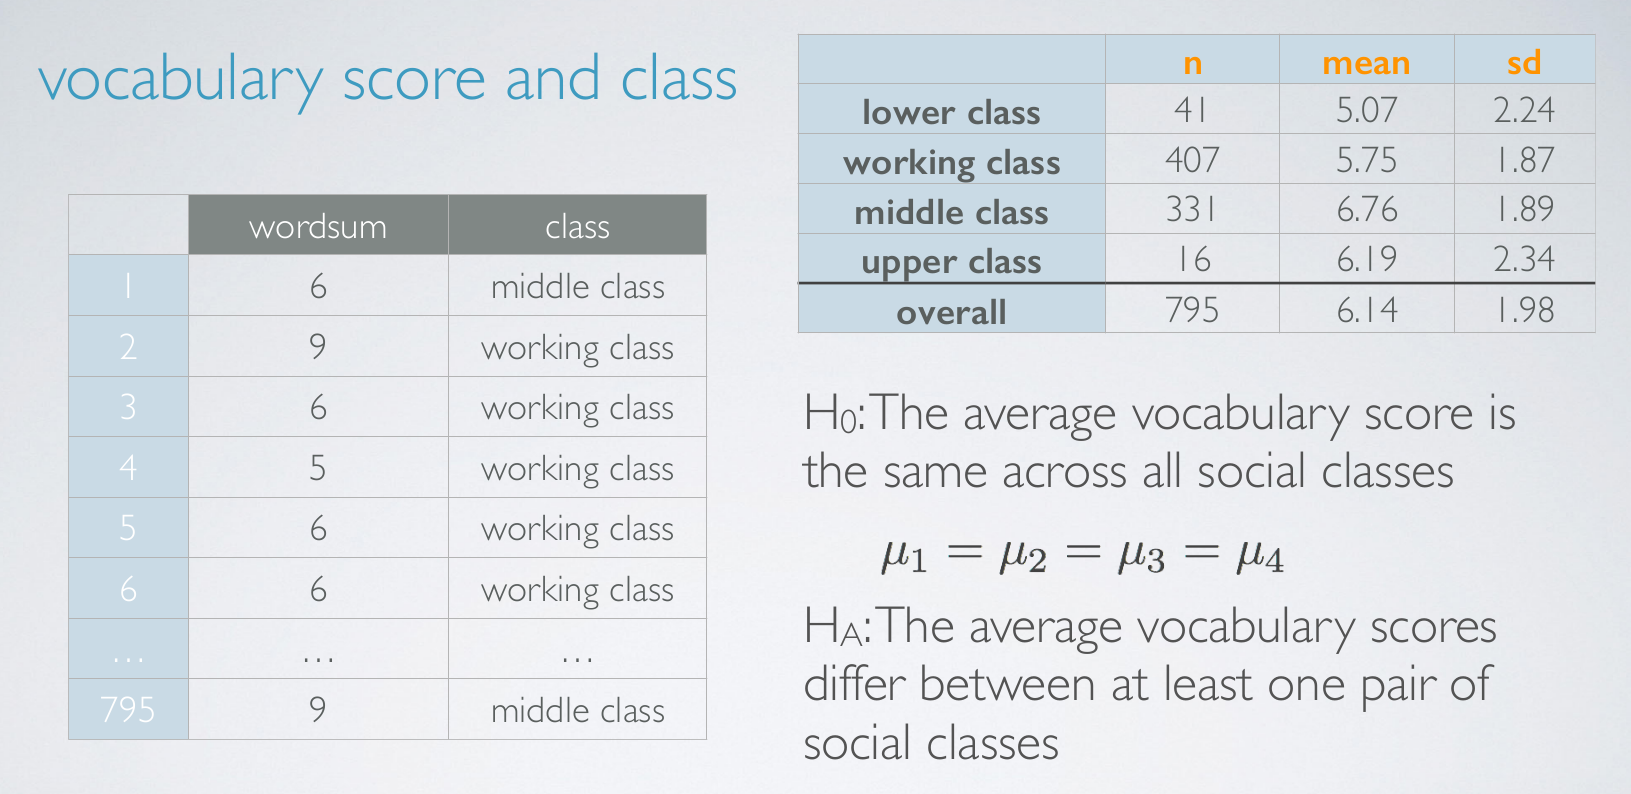
vocabulary score and class
variability partitioning
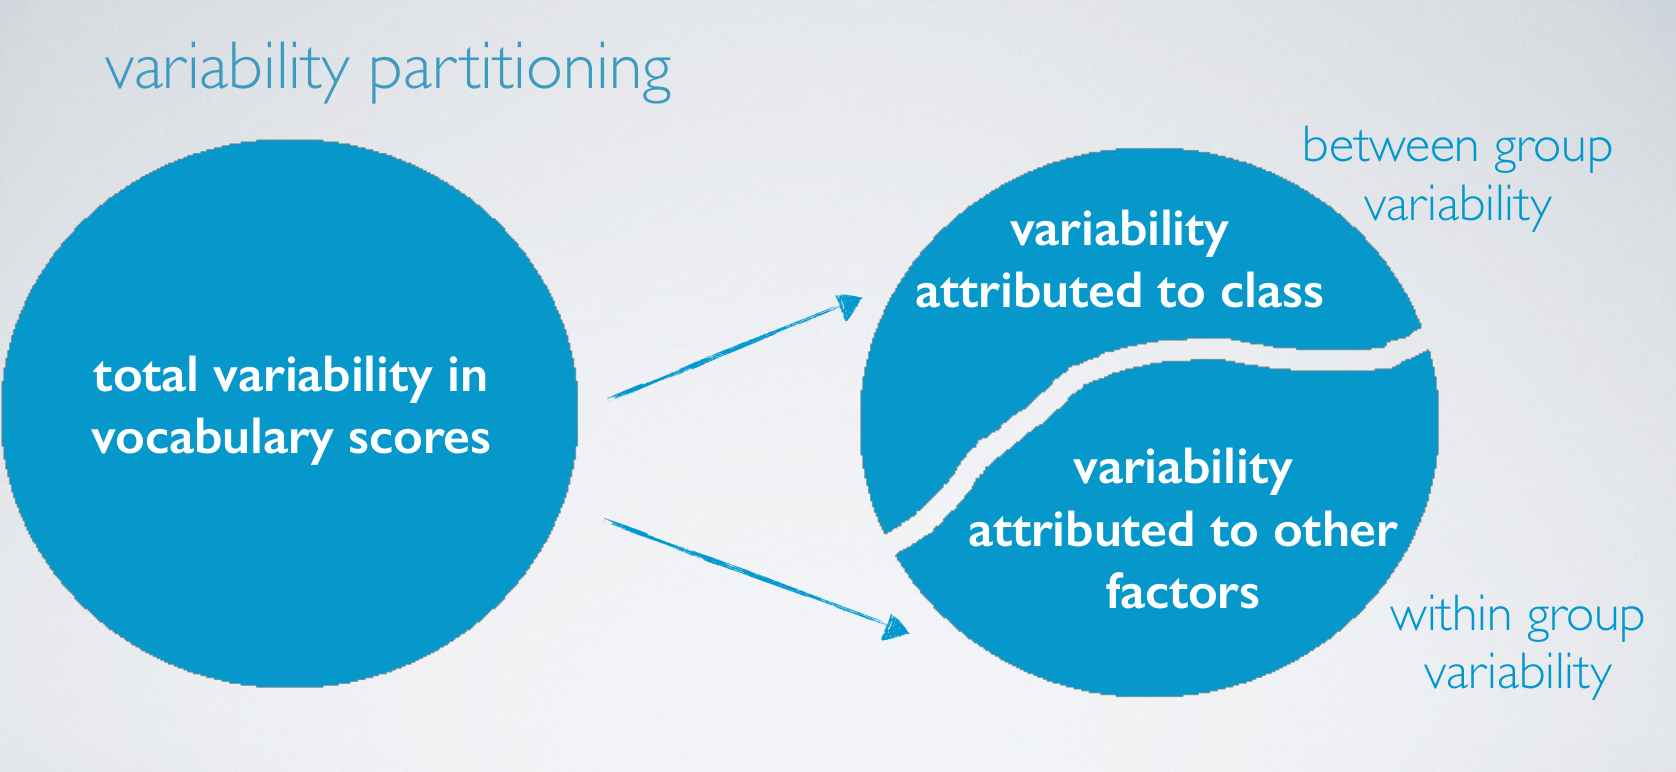
Suppose the circle represents the total variability in vocabulary scores. We partition the variability in to two variability that can be attributed to differences in social class and variability attributed to all other factors.
Variability attributed to social class is called the between group variability since social class is the grouping variable in our analysis, and the other portion of the variability is what we're not interested in. And in fact it's somewhat of a nuisance factor for us.
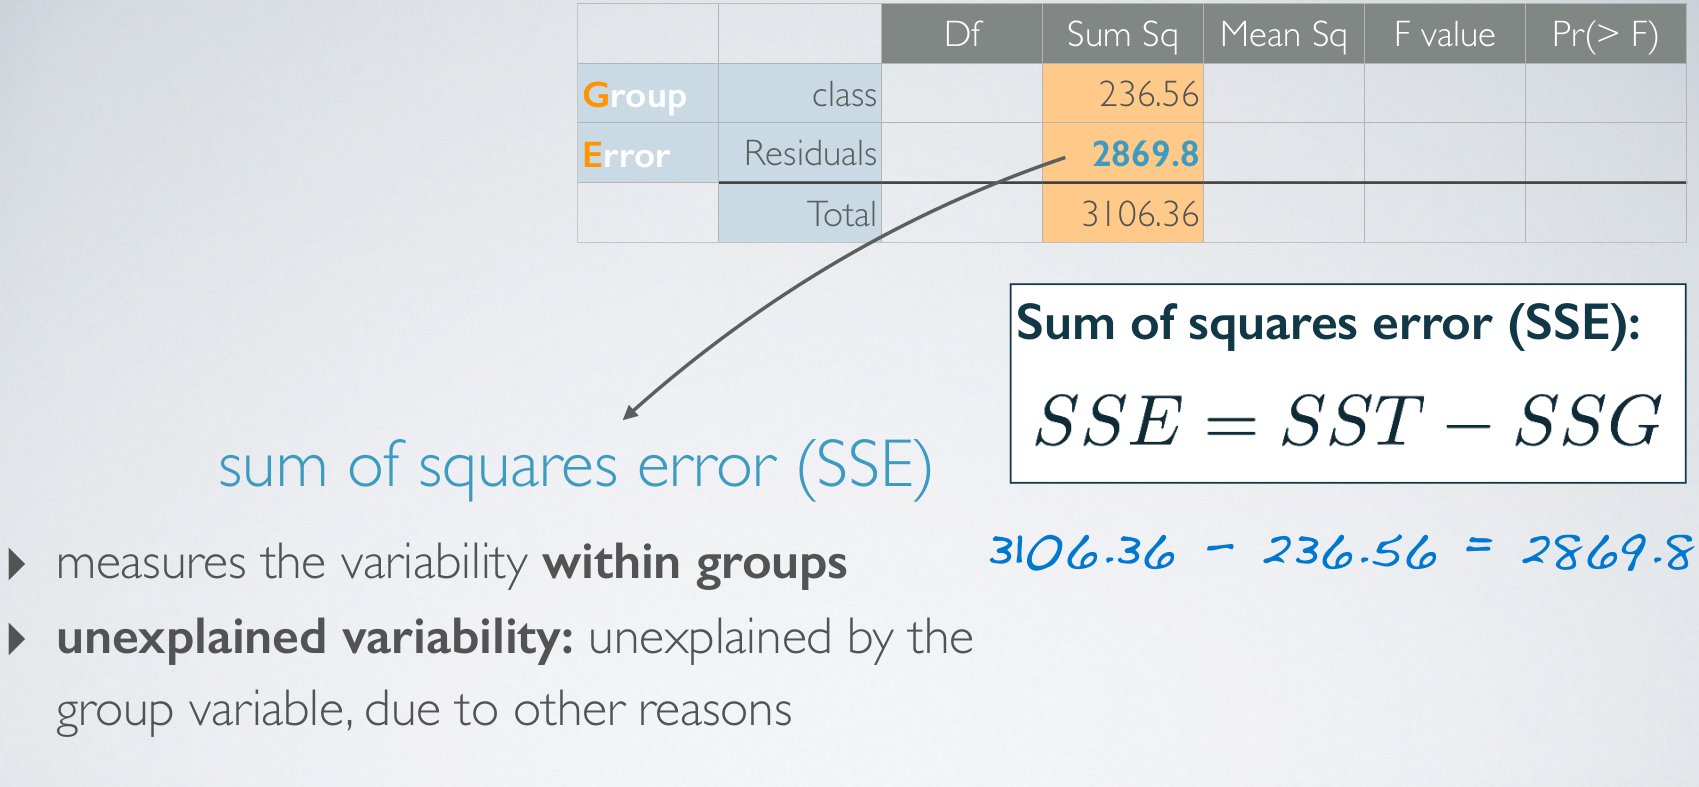
Since, if everyone within a social certain class scored the same, then we would have no variability attributed to other factors. This portion of the variability is called our within group variability.SST
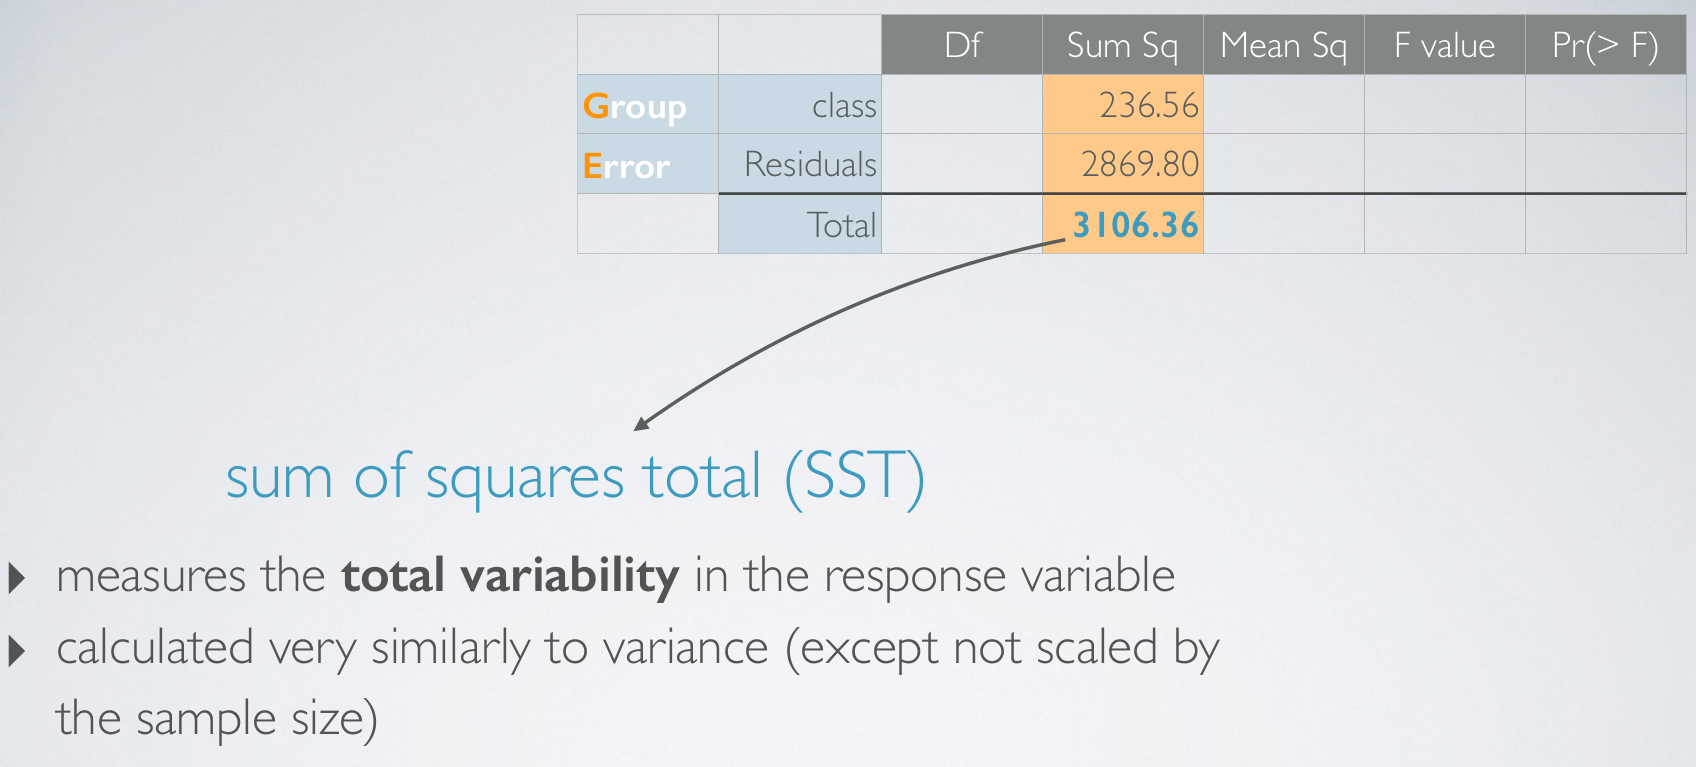
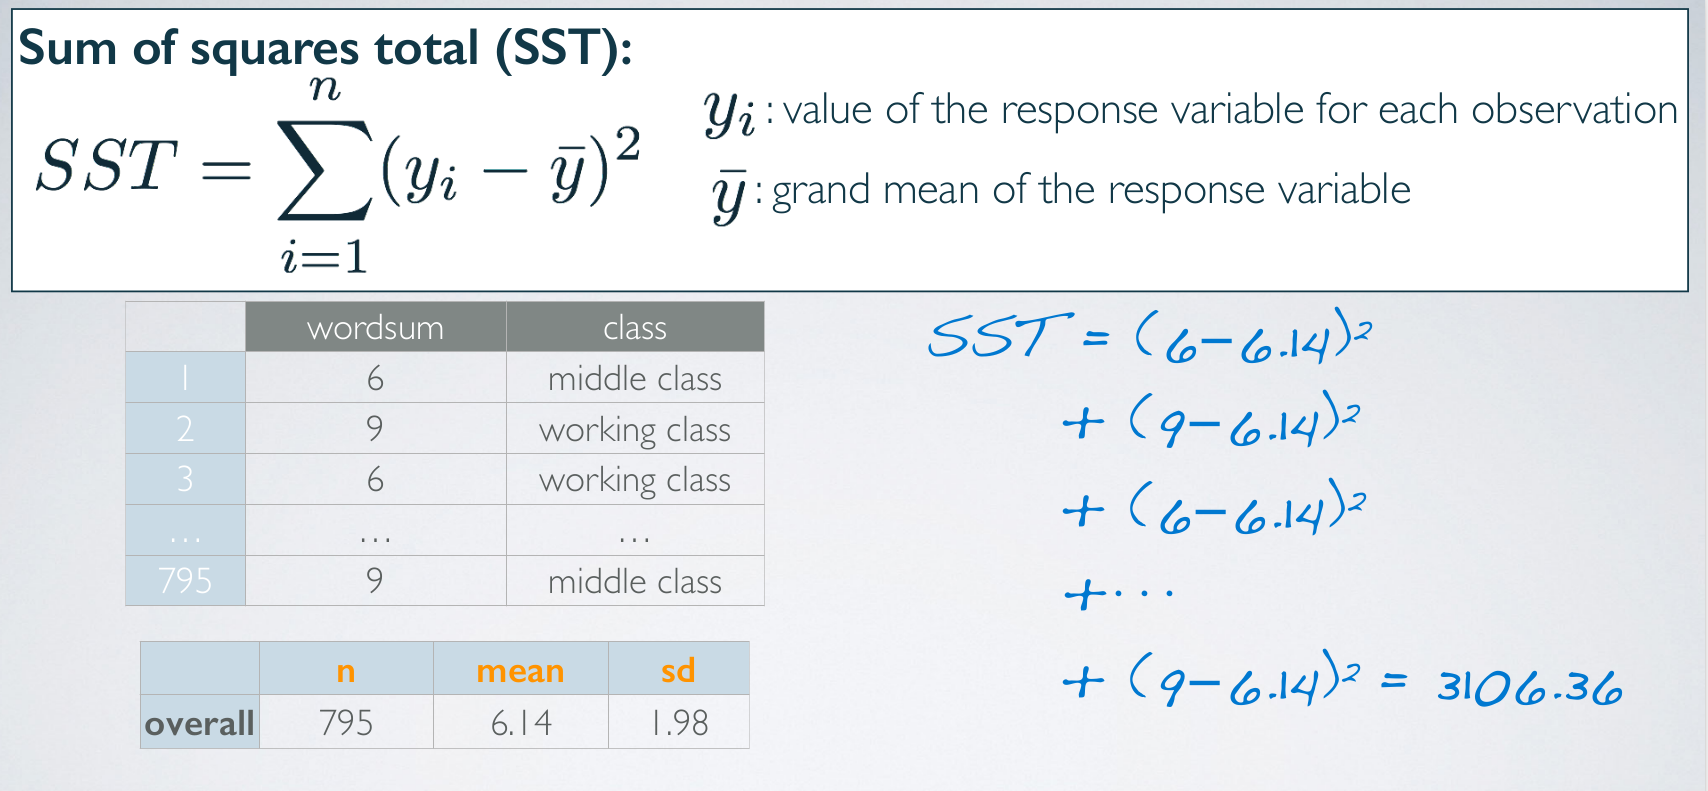
SSG
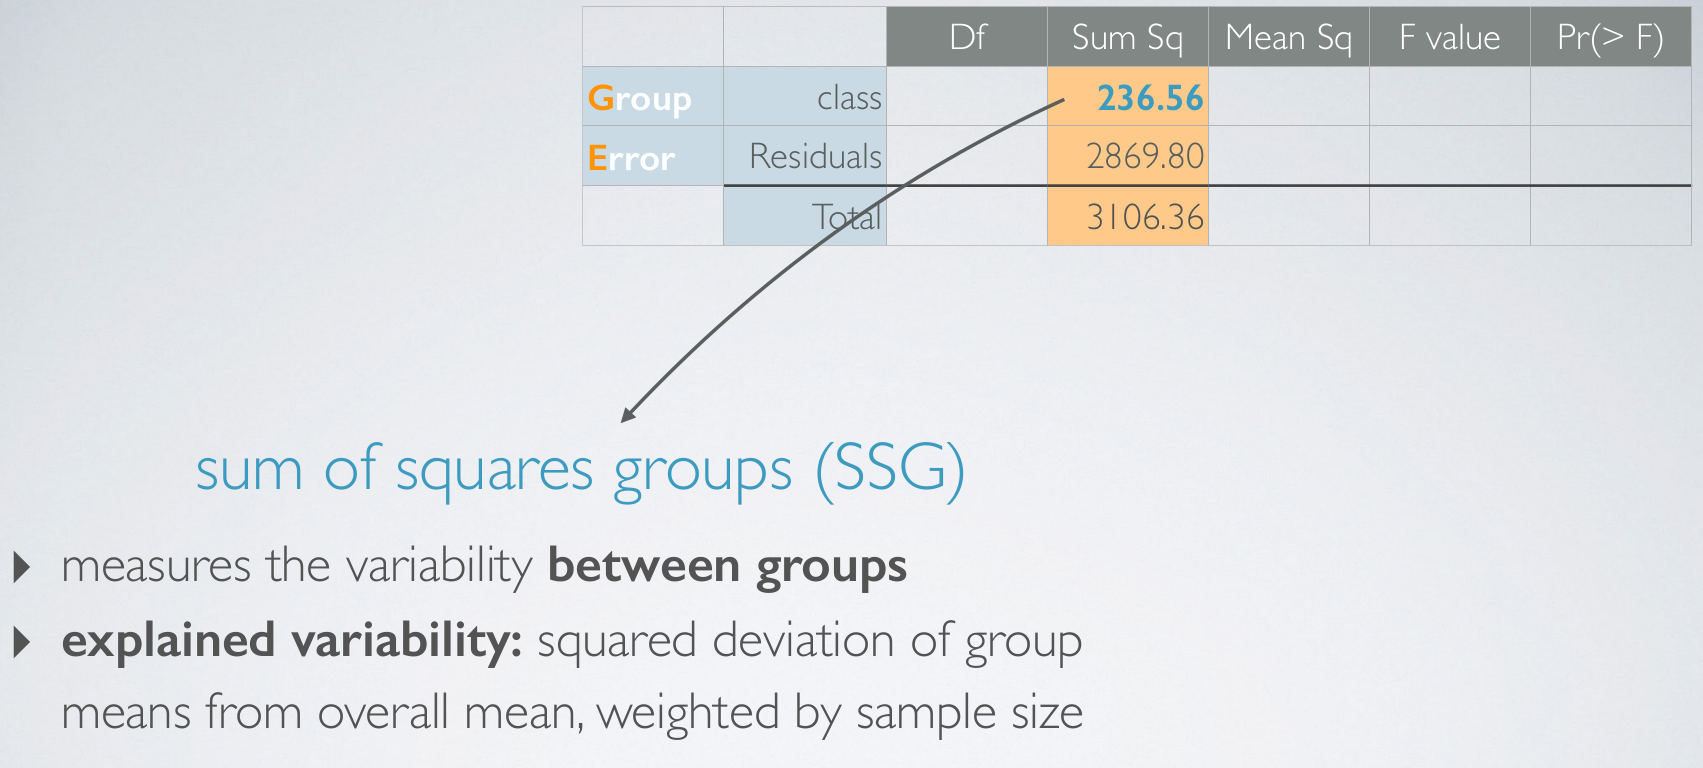
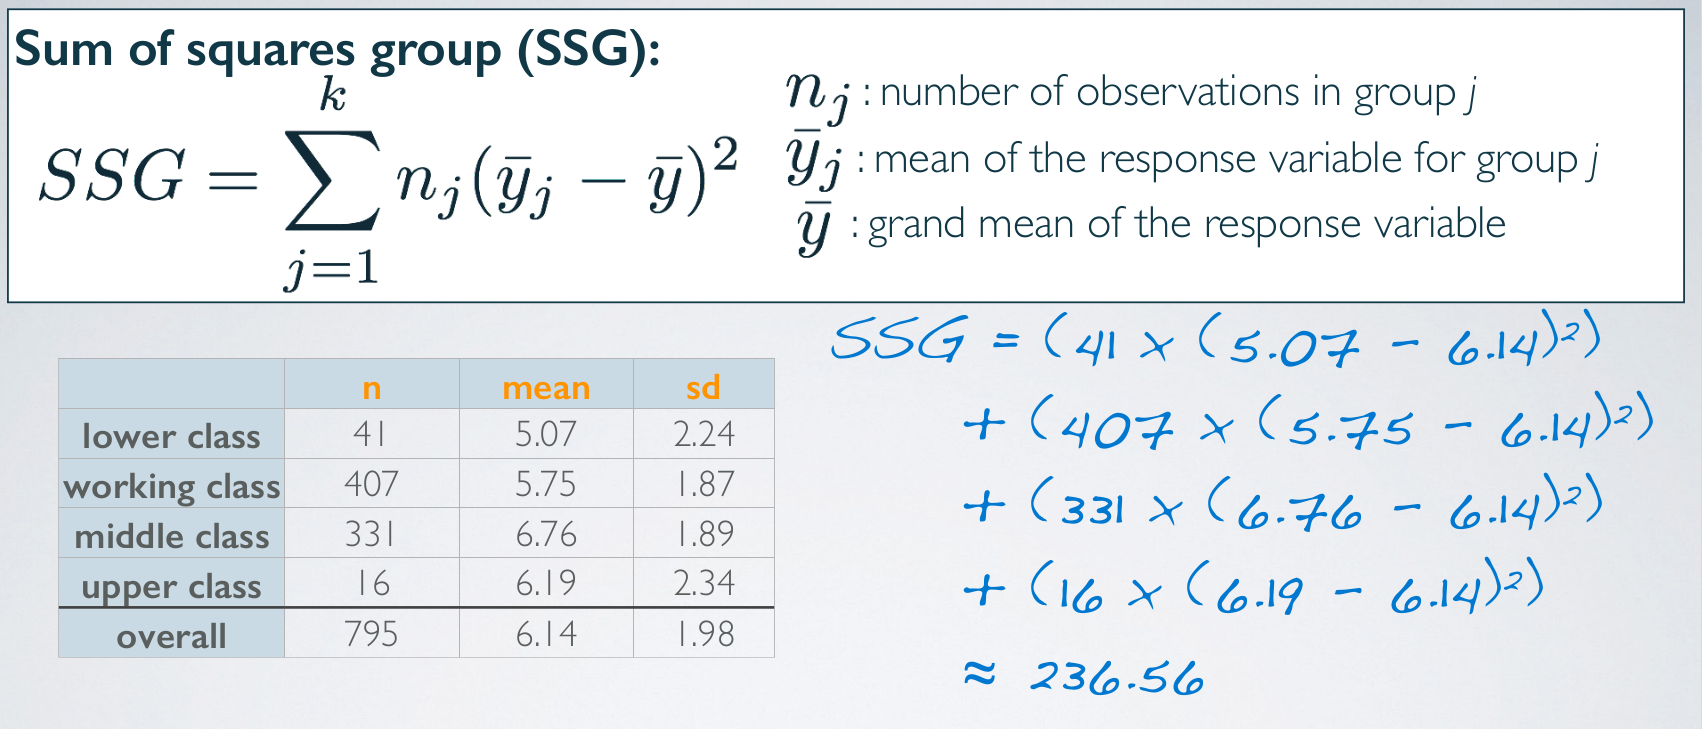
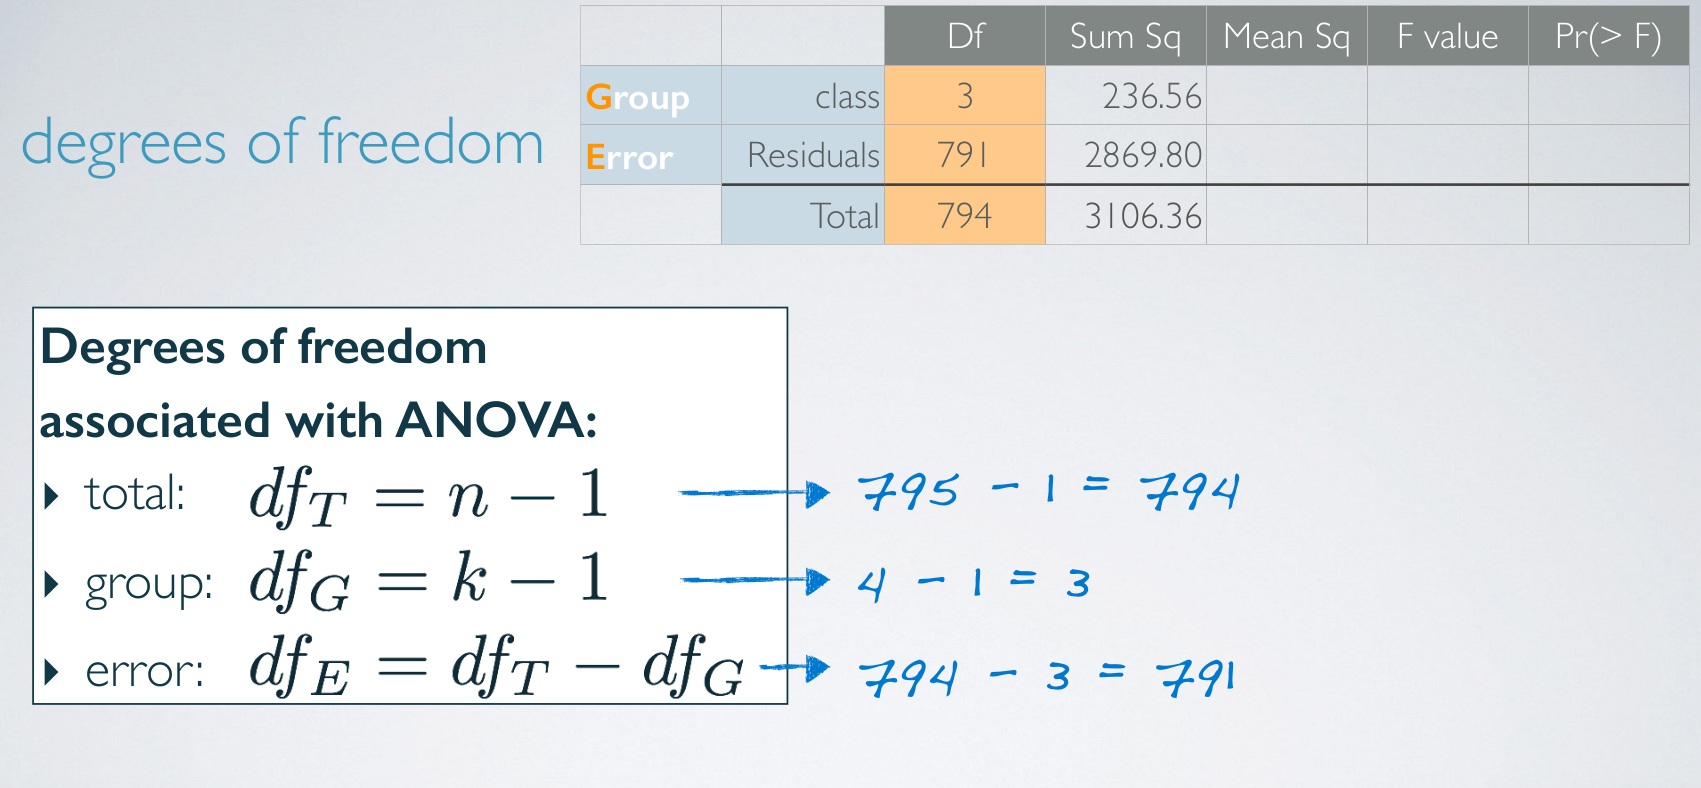
df
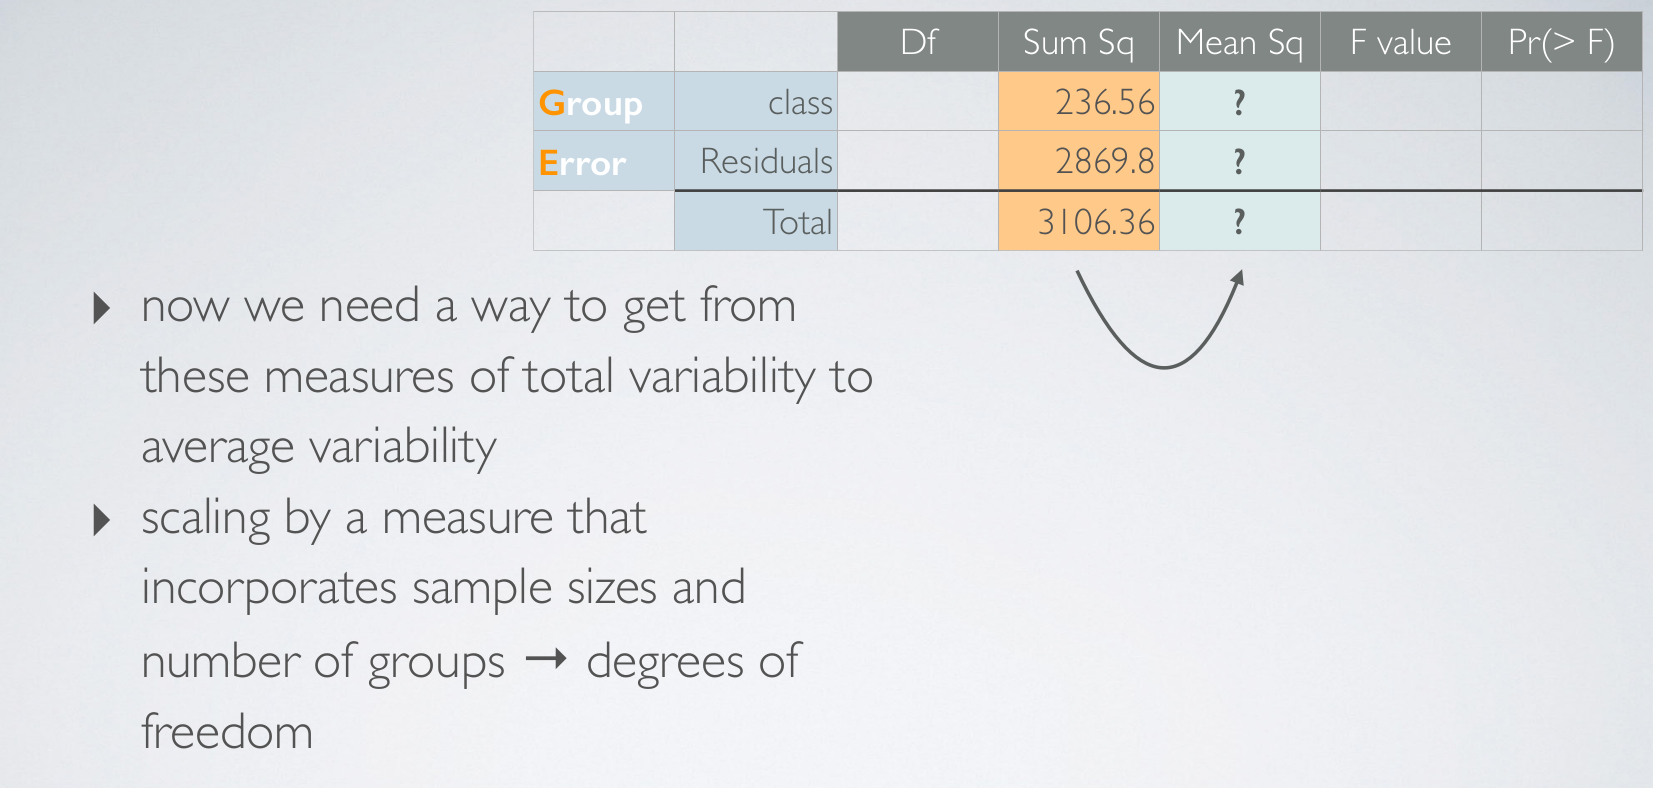
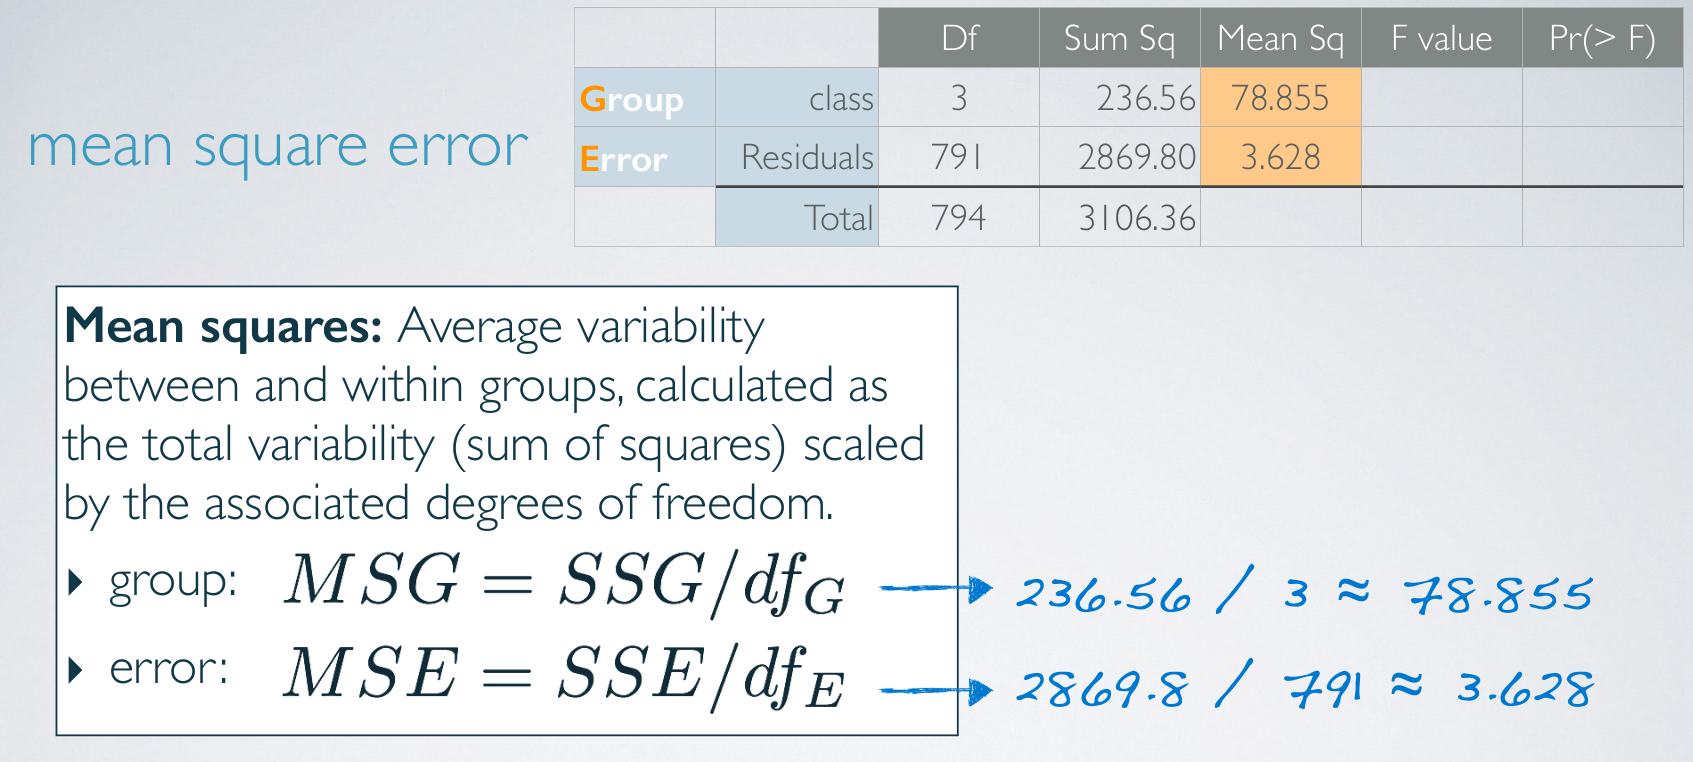
MSE
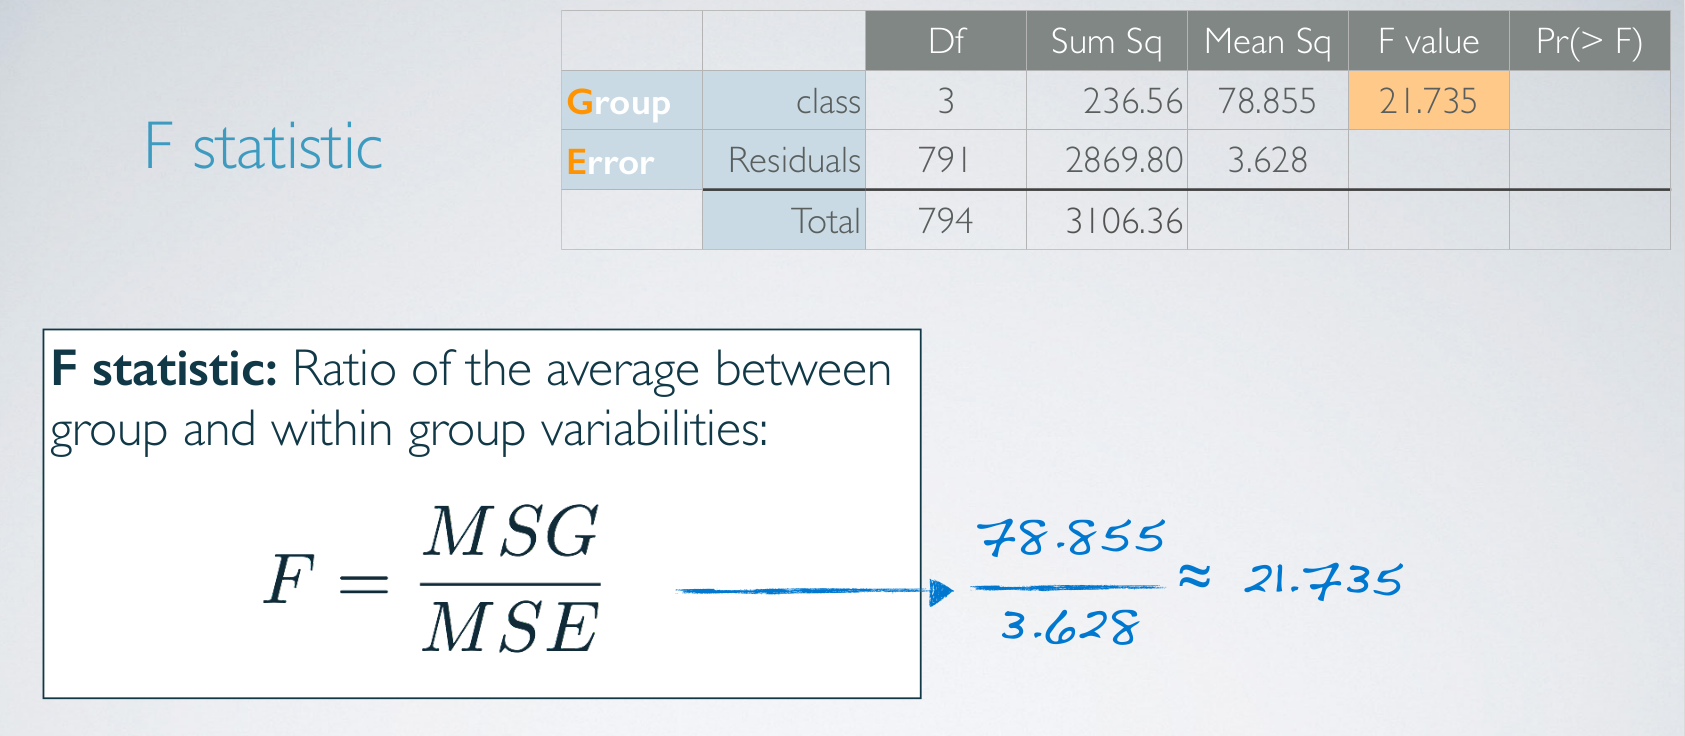
F statistic
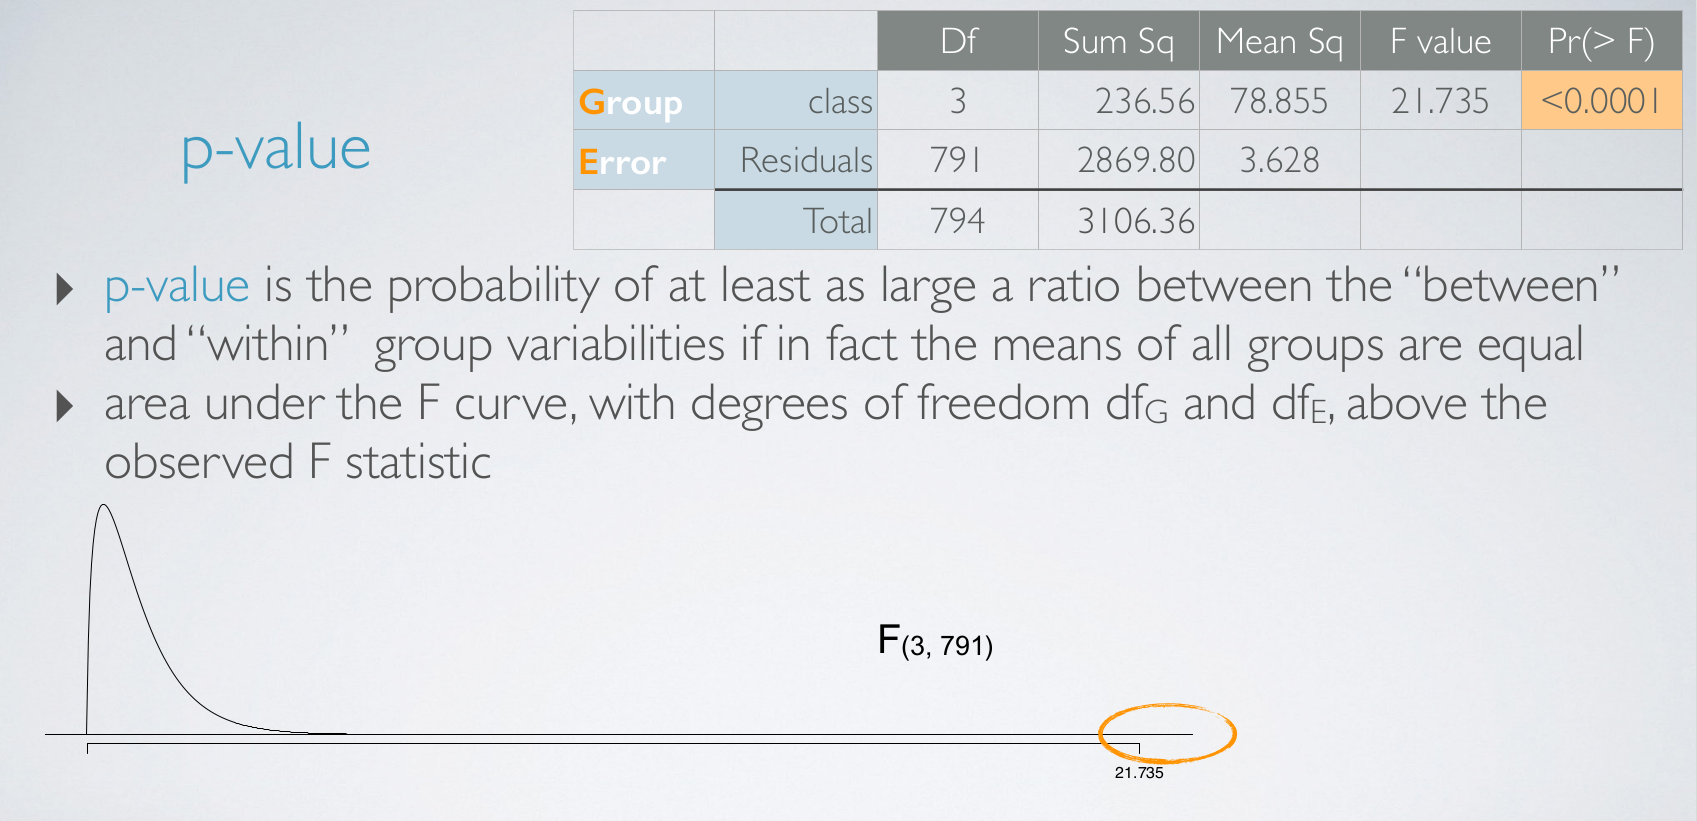
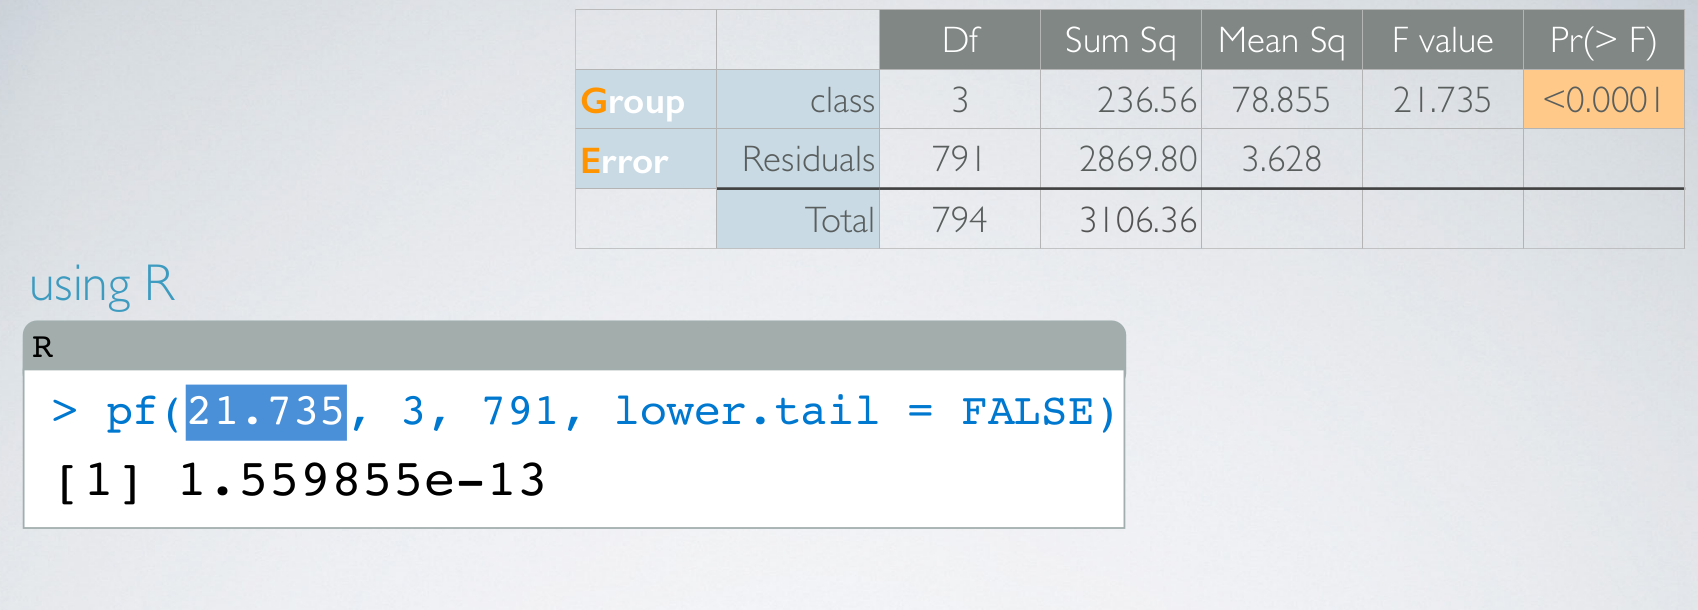
p-value
conclusion
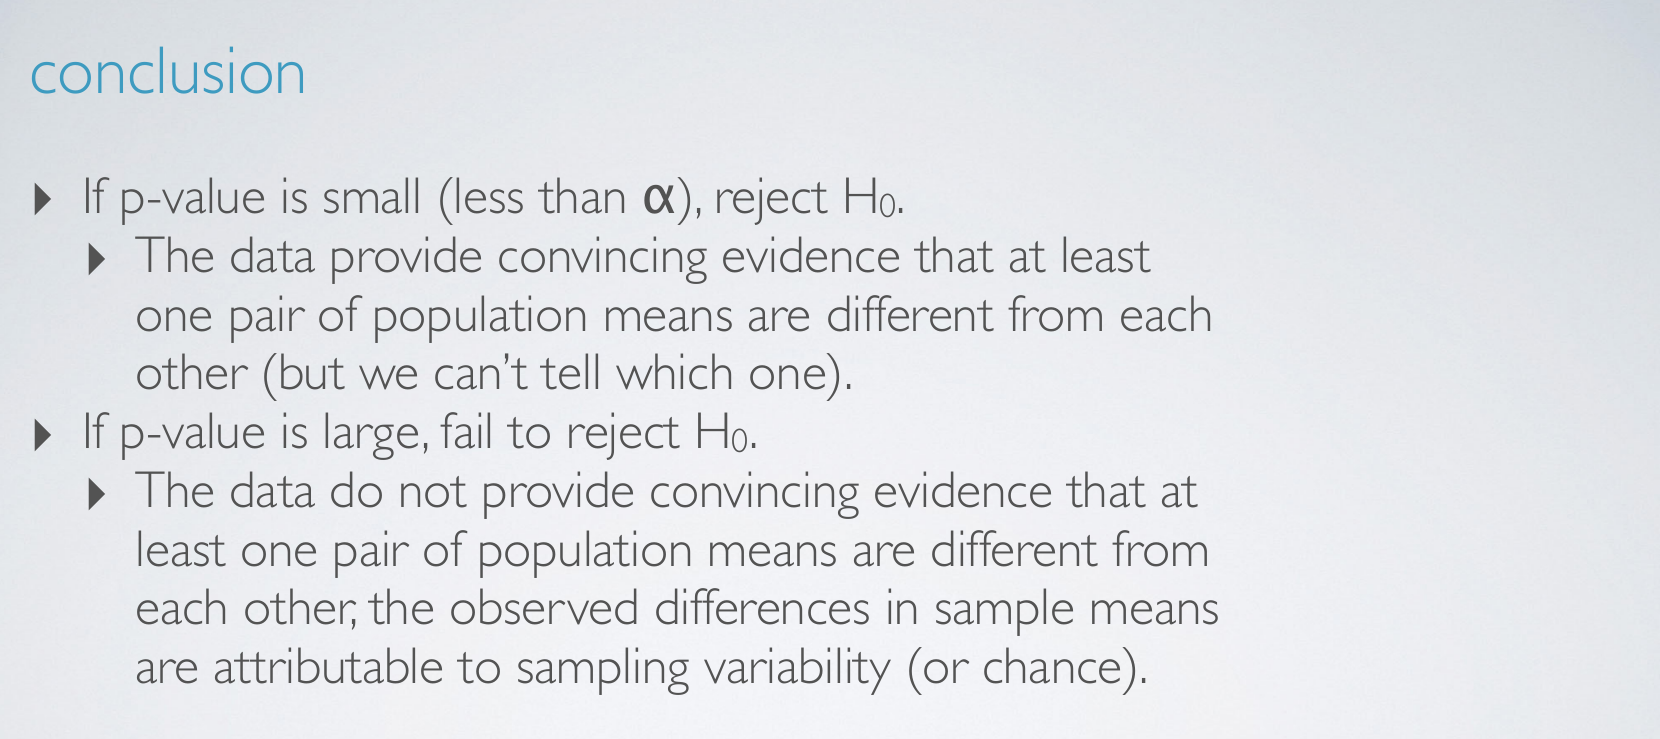
注意只是其中某一对,我们并不知道是哪一对。
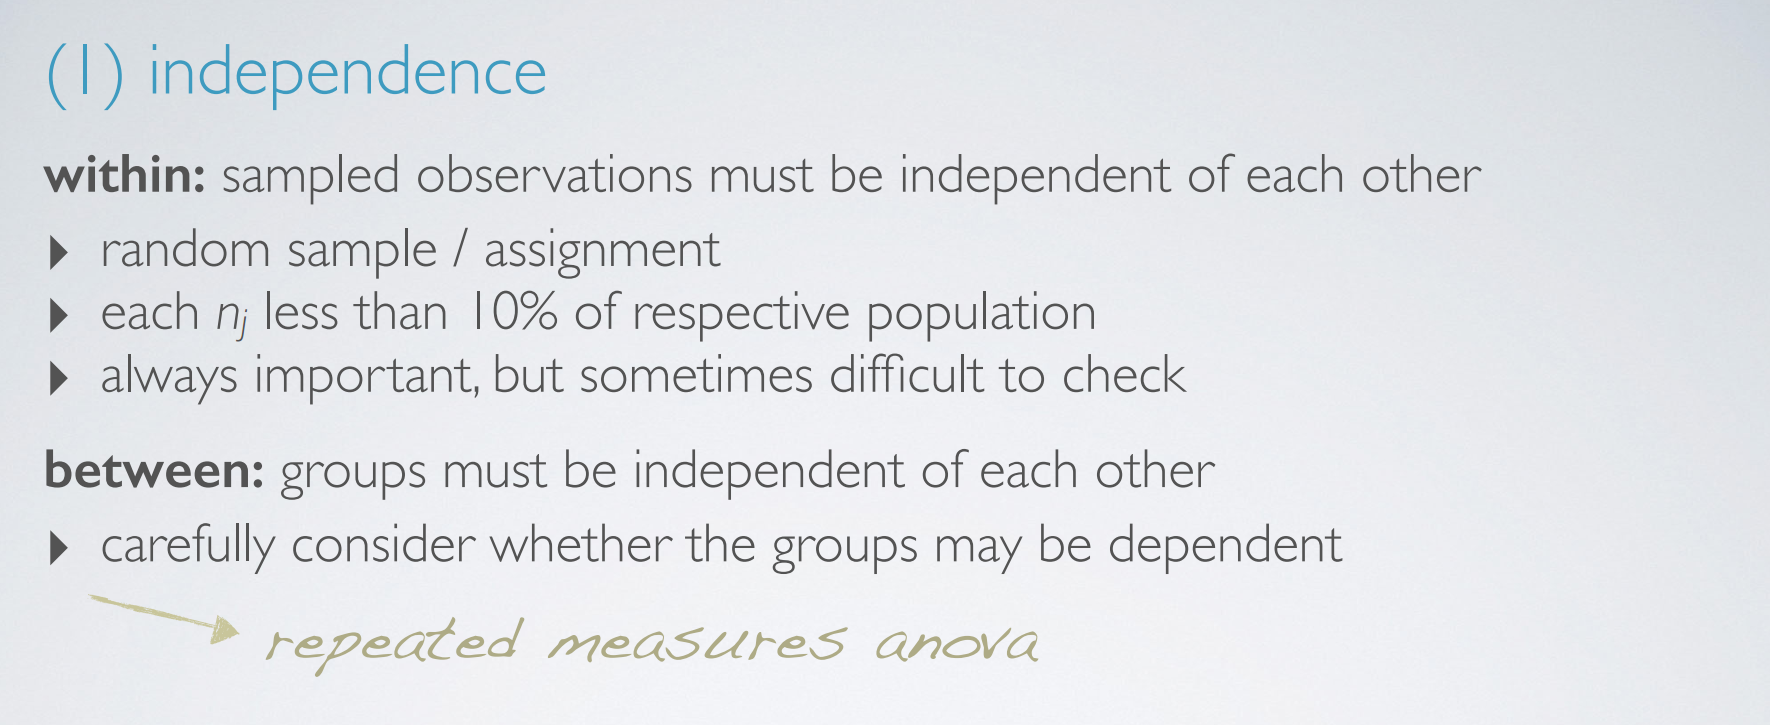
3. conditions for anova
使用ANOVA的一些条件
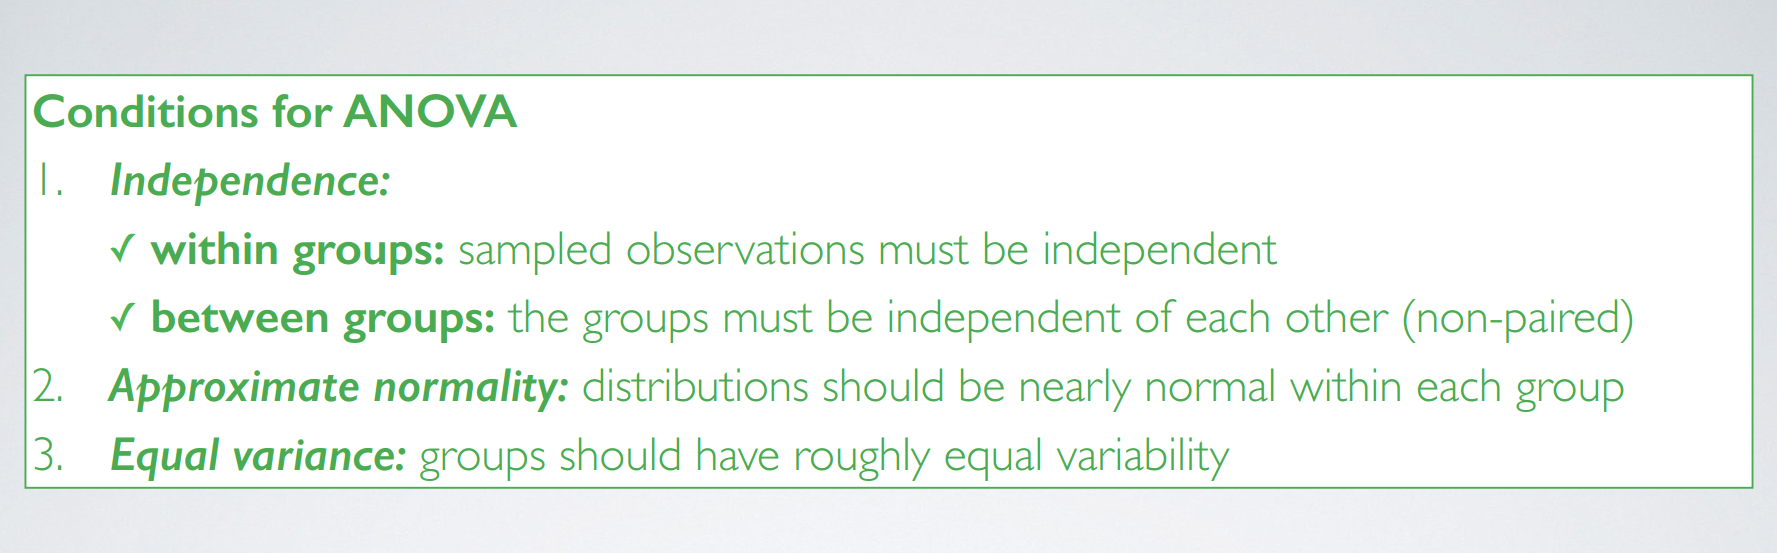

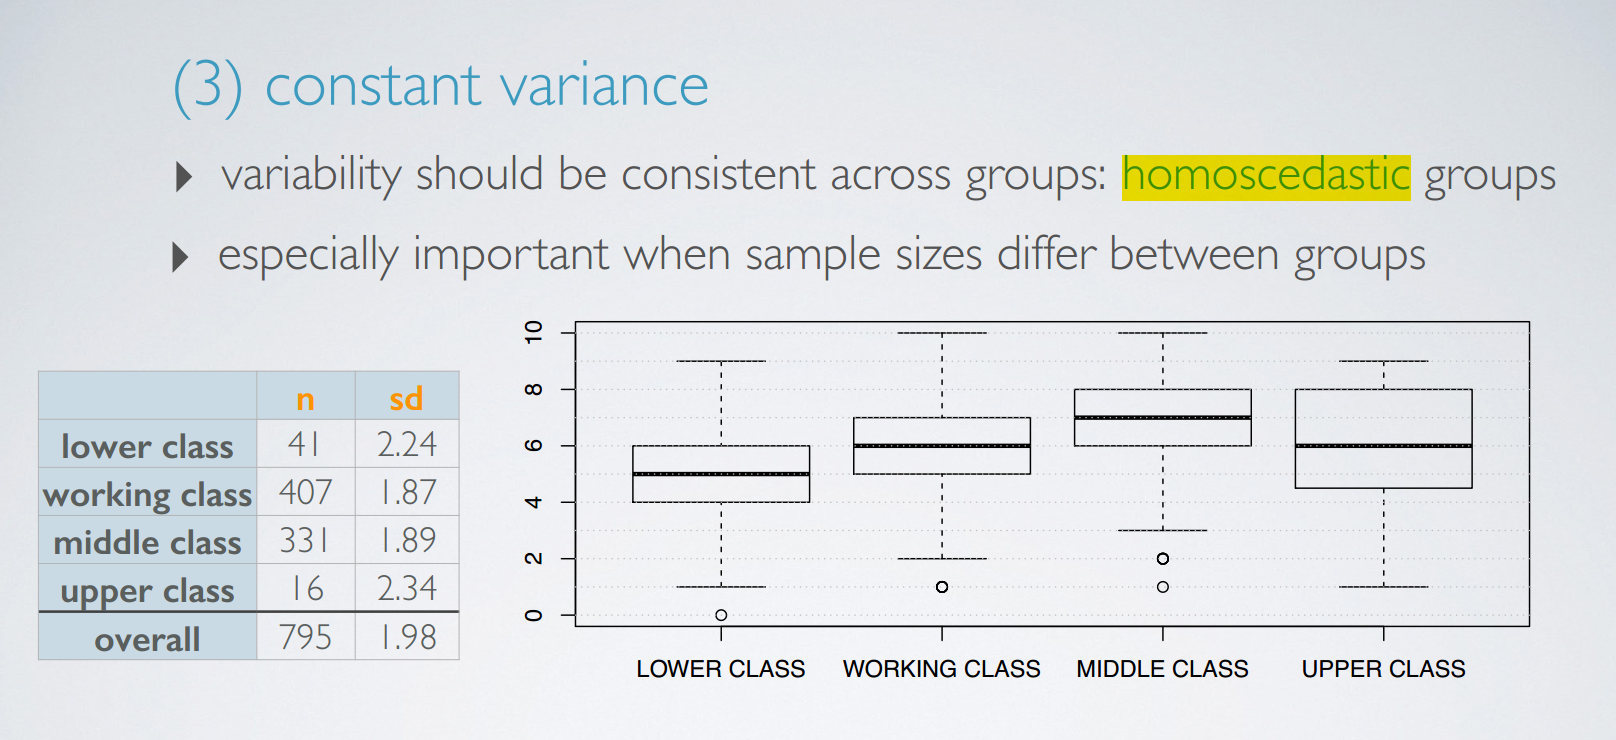
同方差的
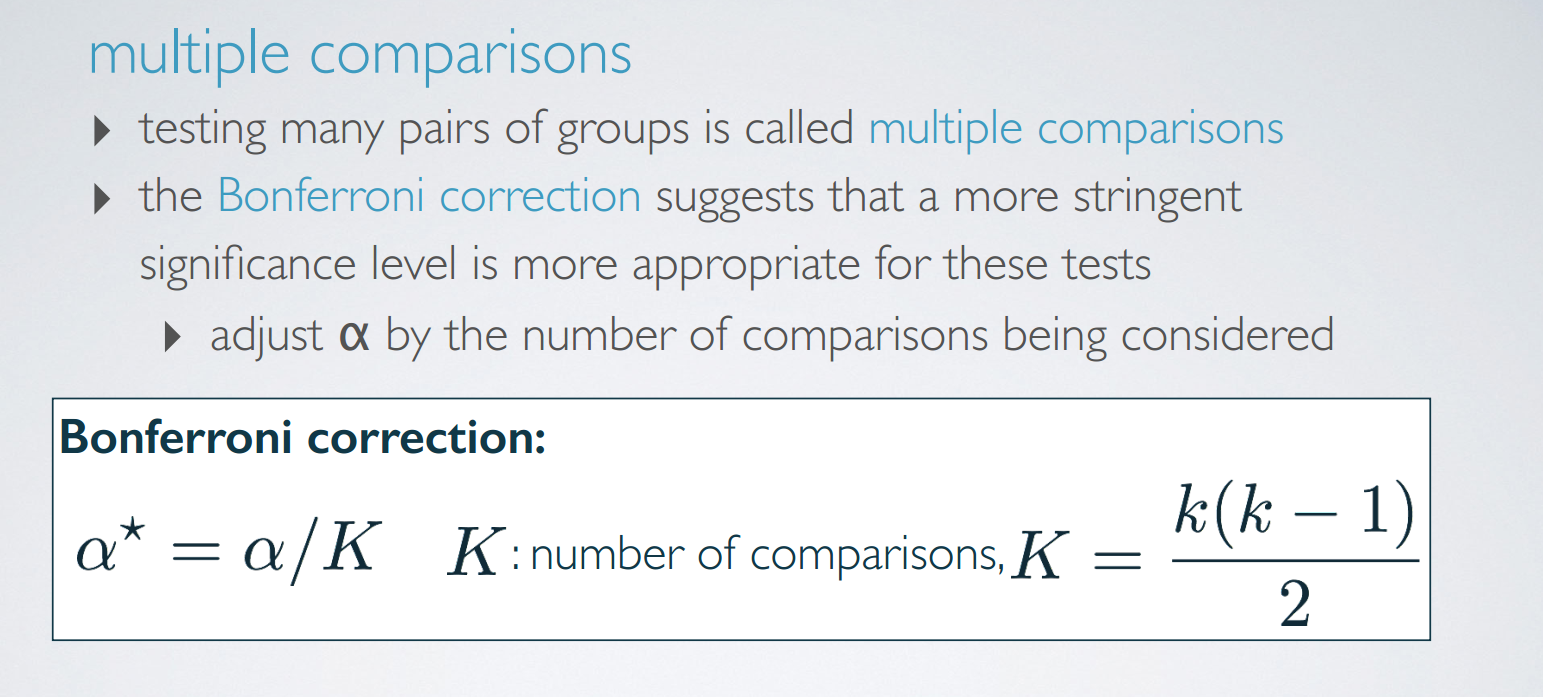
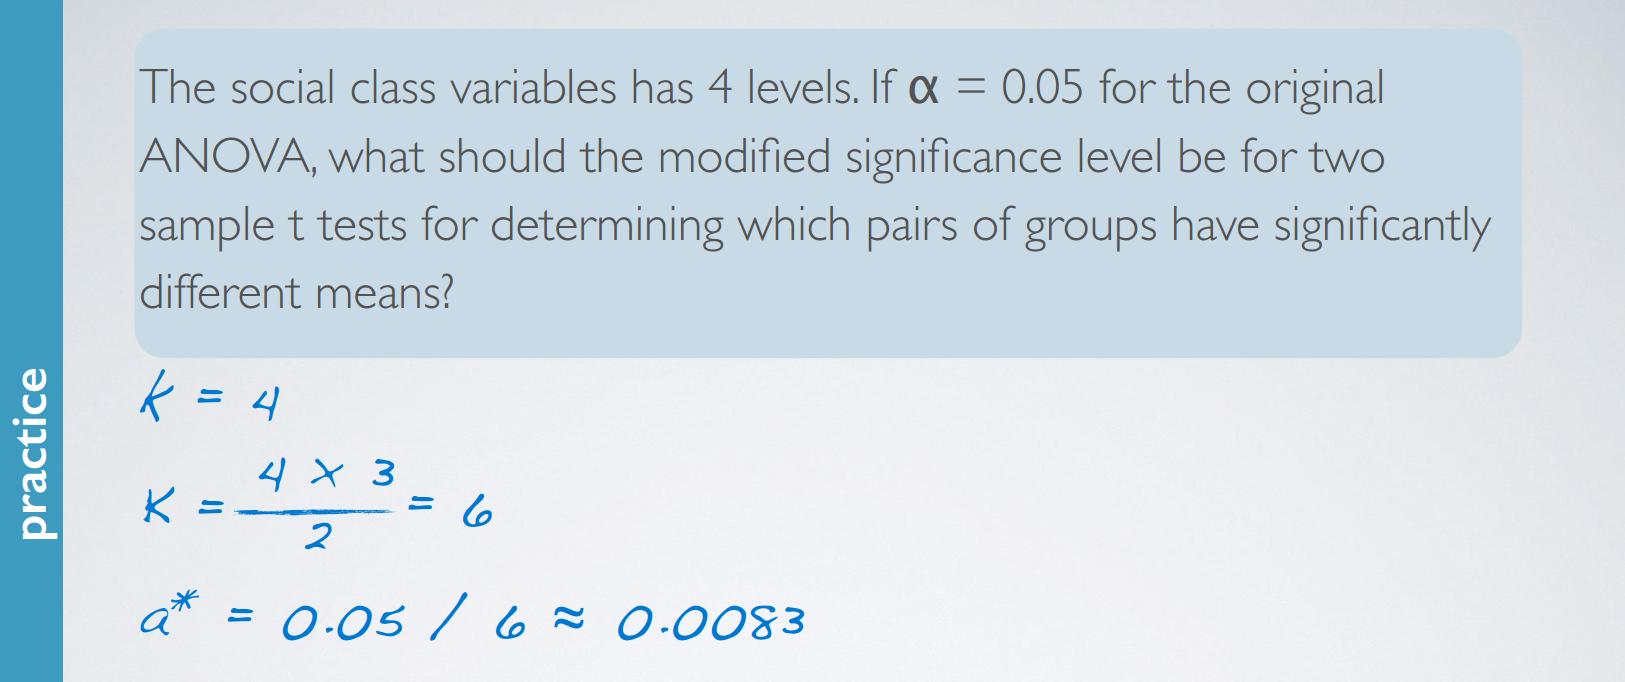
4. multiple comparisons
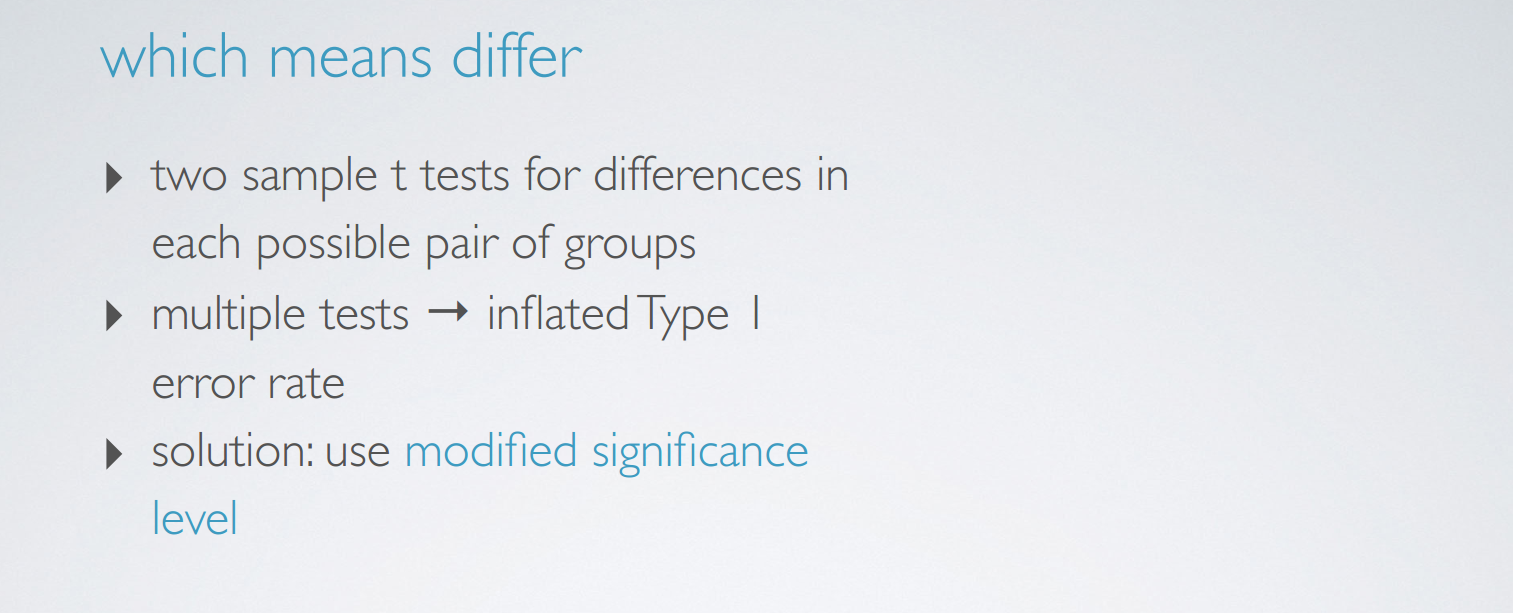
Remember that to determine whether two means are different from each other, we use t tests. And with each test that you do, you incur a probability of doing a Type I error. The probability of committing a Type I error is the significance level of the test, which is often set to 5%. So when you do multiple tests, you're going to be inflating your Type I error rate, which is an undesirable outcome. Thankfully, there is a simple solution. Use a modified significance level that is lower than the original significance level for these pairwise tests, so that the overall Type I error rate for the series of tests you have to do can still be held at the original low rate.
多次作检验,会增加type 1 error发生的概率,或的关系吗?
每一对都可能会发生type 1 error,多次作检验,最后发生type 1 error的概率是与所有对发生type 1 error的概率之和正相关的。
5. Bootstrapping
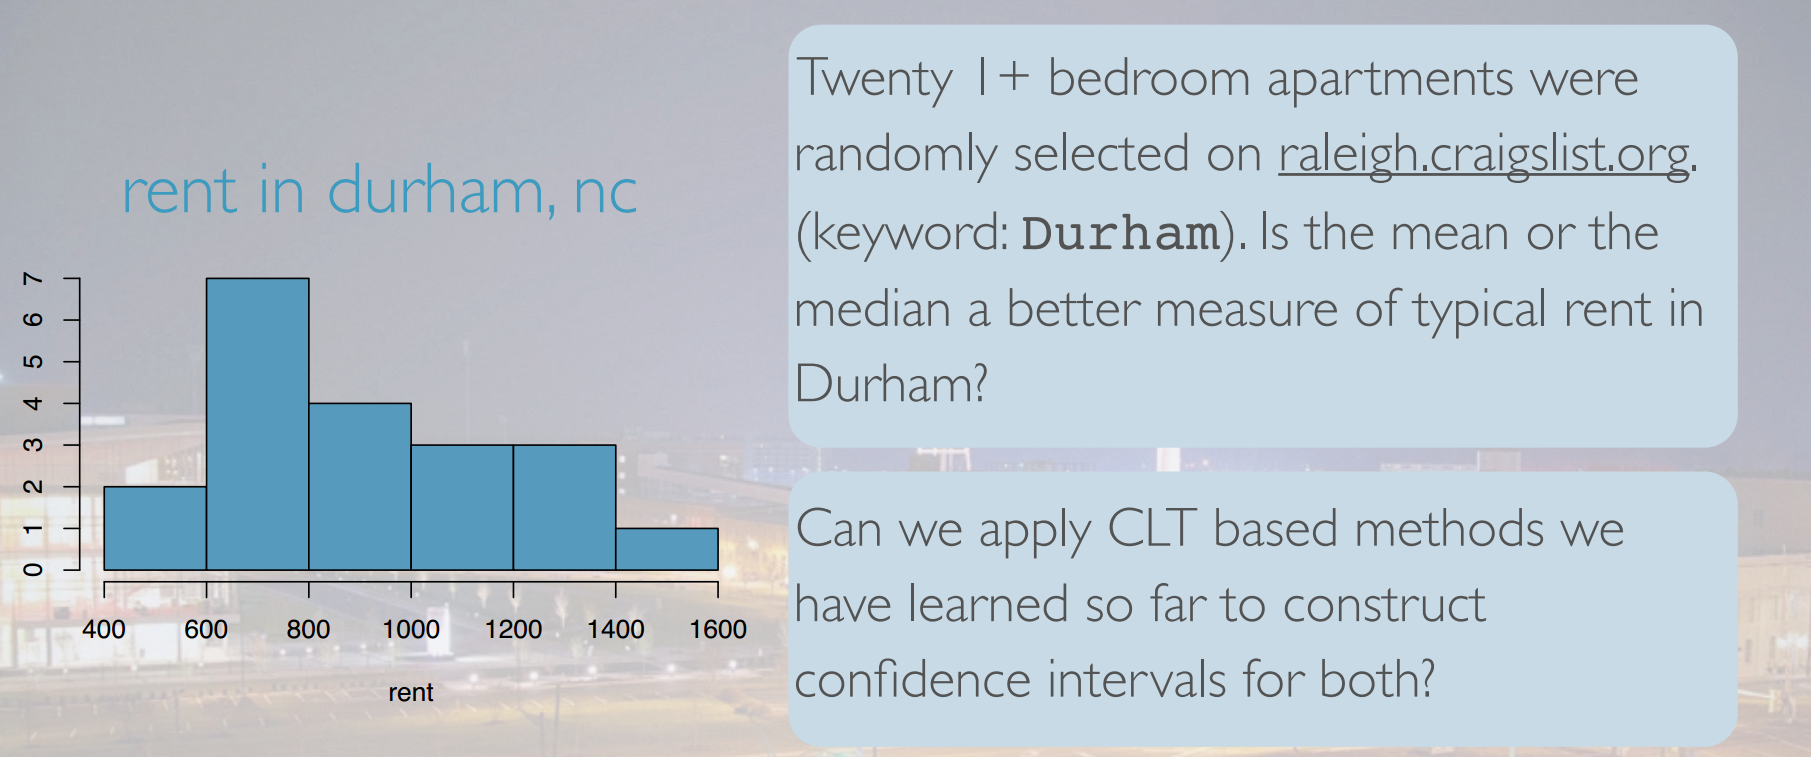
不满足CLT的条件,不可以使用。
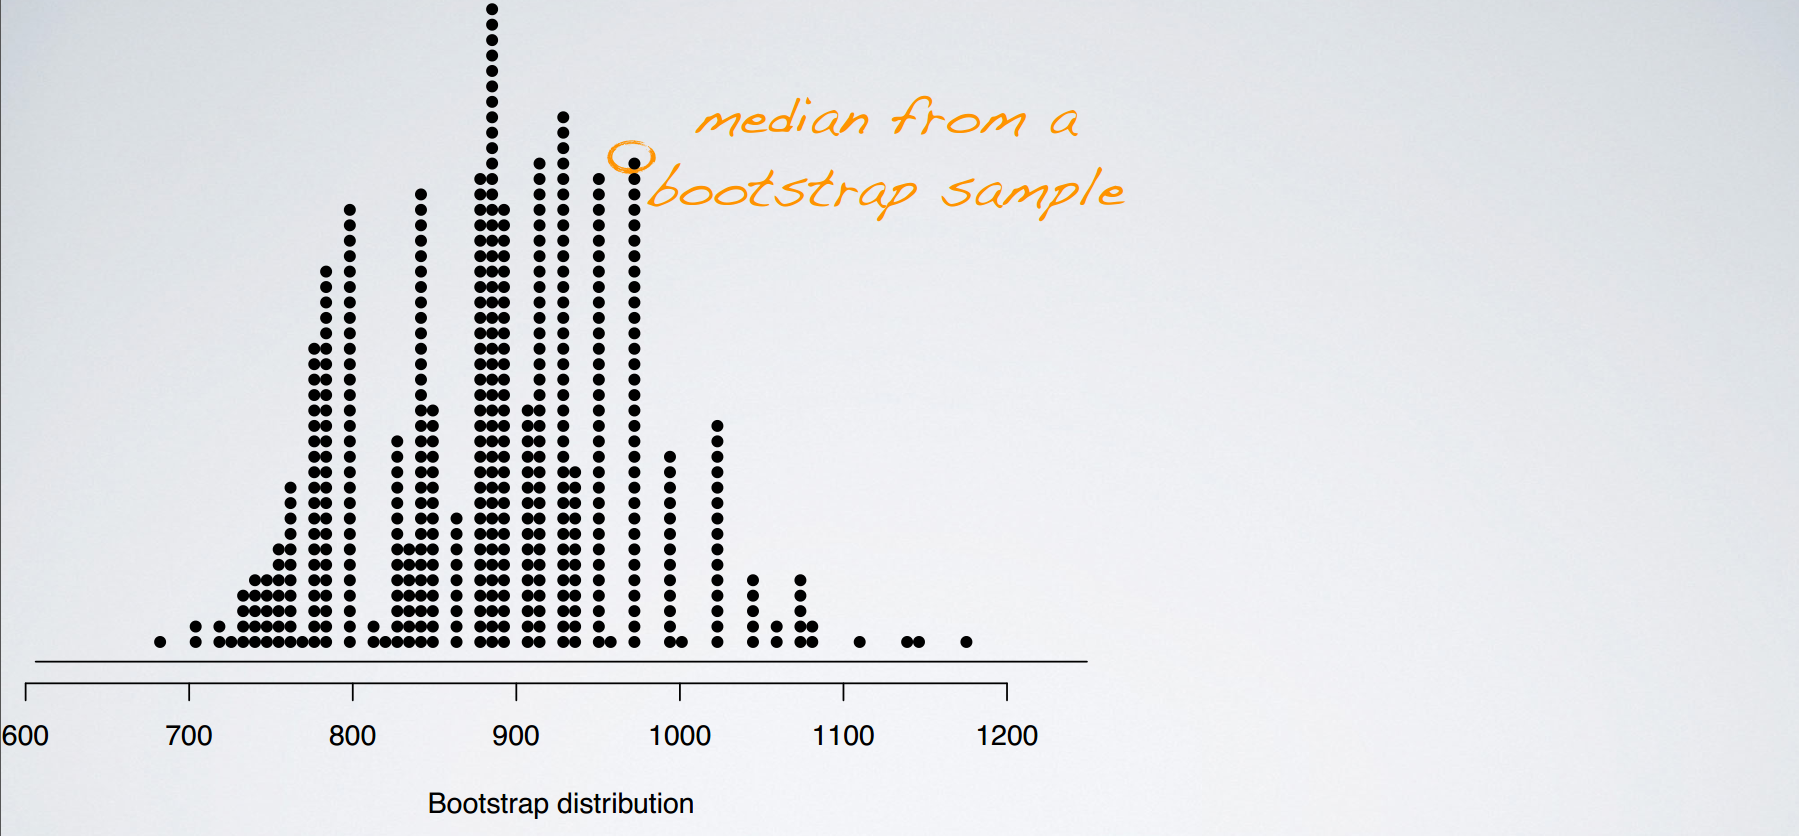
bootstrapping
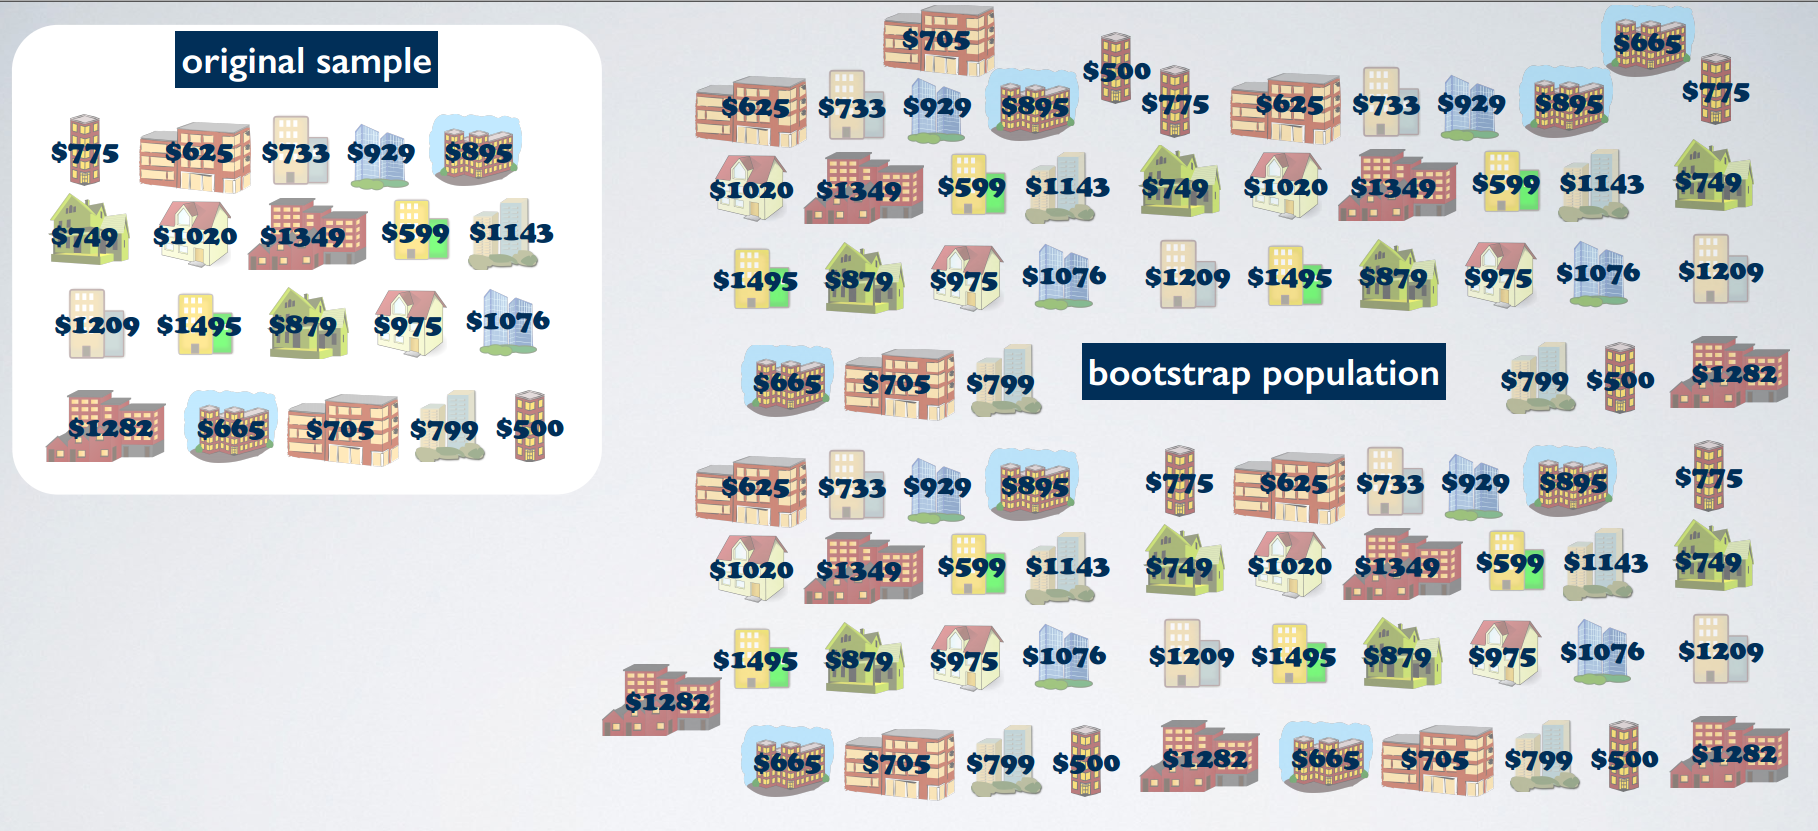

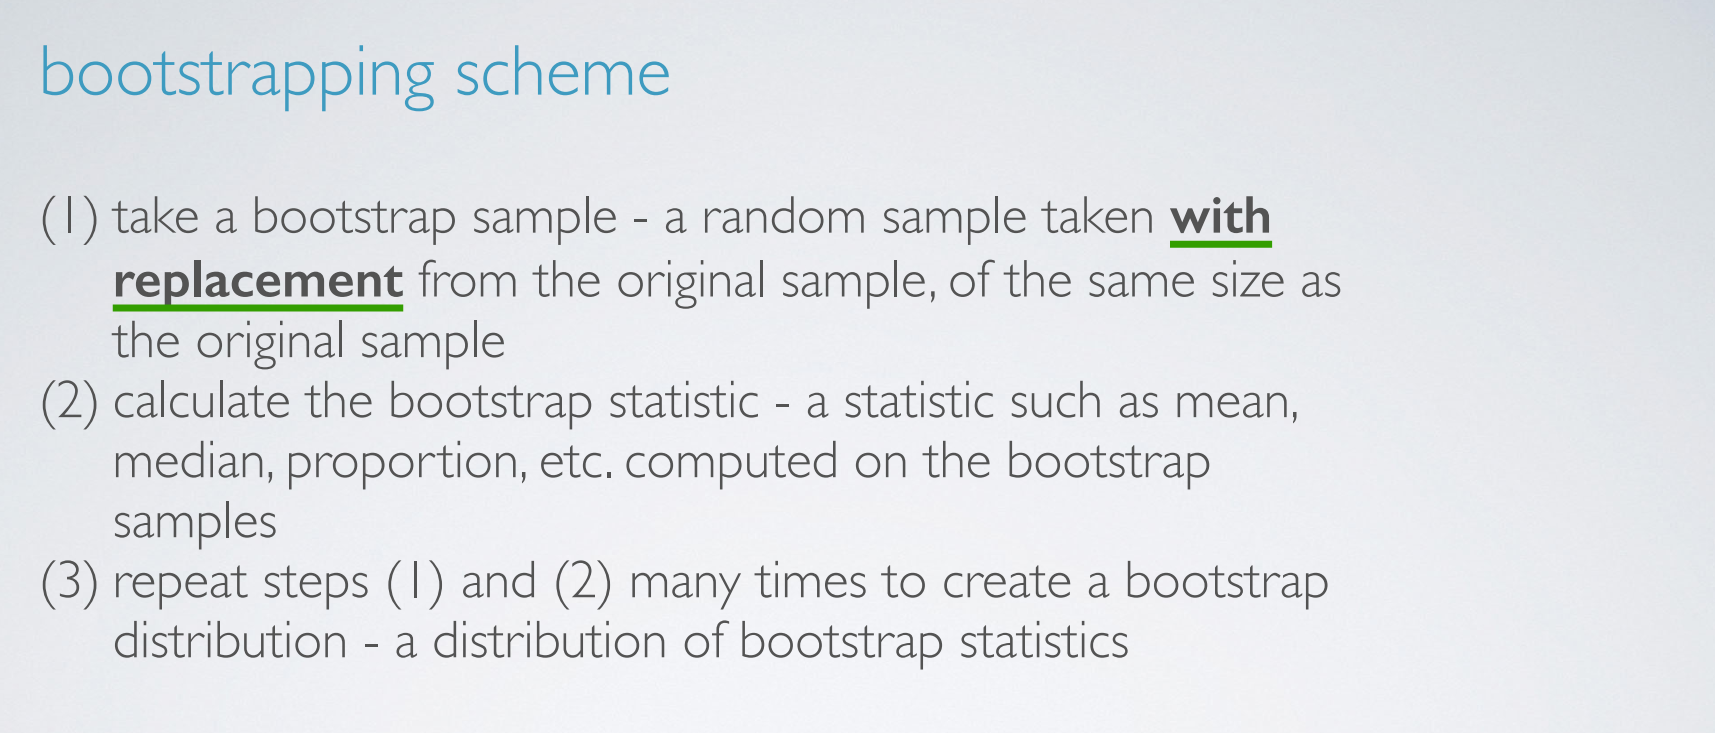
bootstrapping scheme
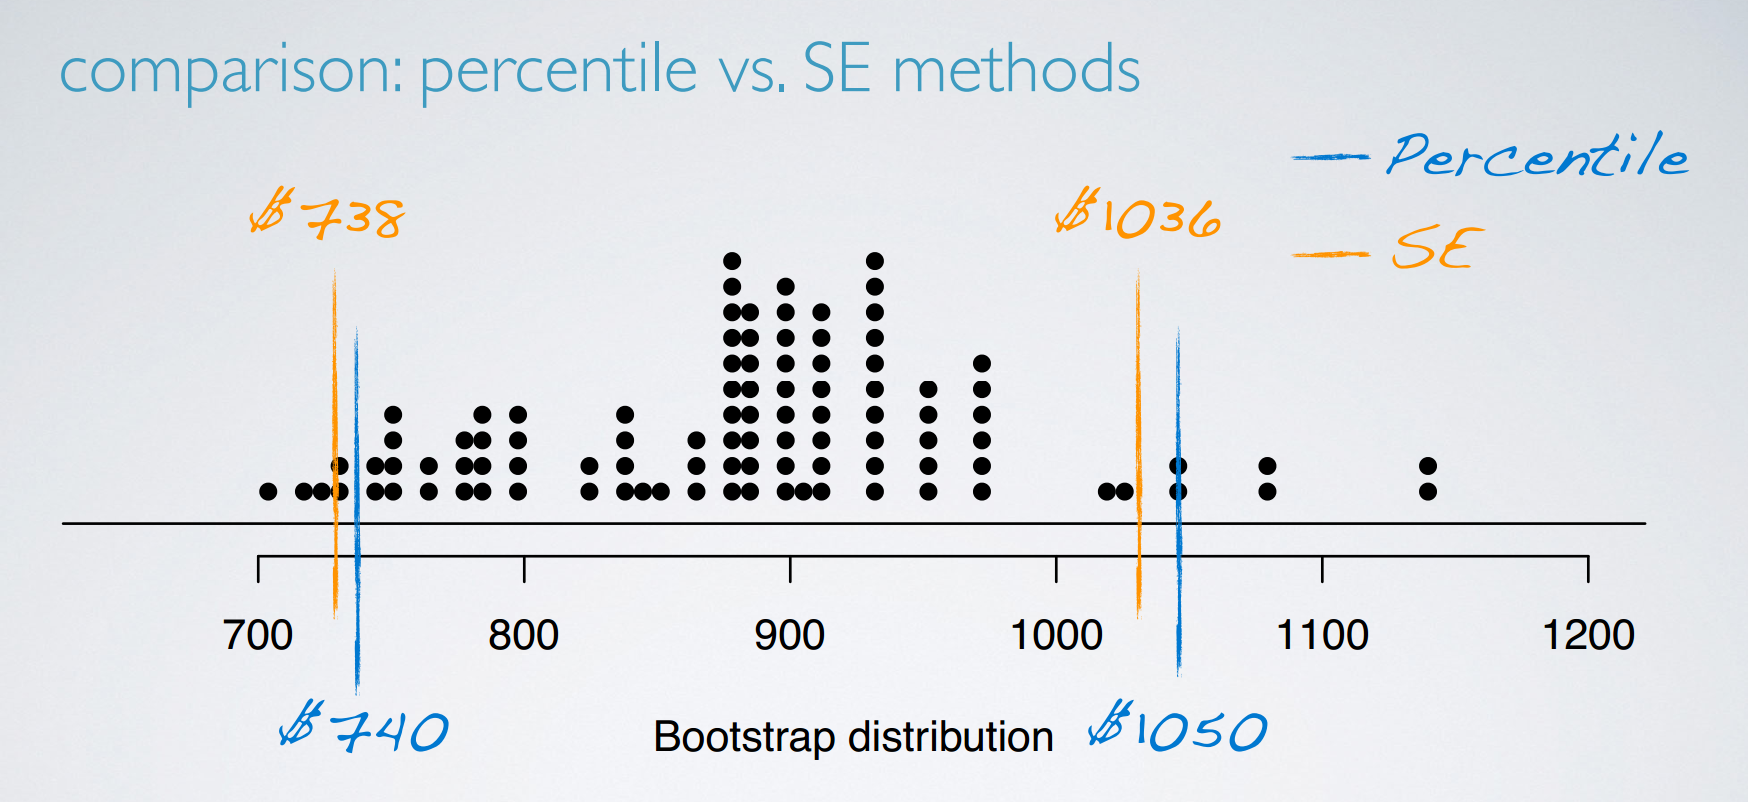
There is a typo in the video: t* should be 1.73 (based on df = 20 - 1 = 19), and hence the interval should be (732, 1042). This correction also affects the next slide where the intervals are drawn on the bootstrap distribution.
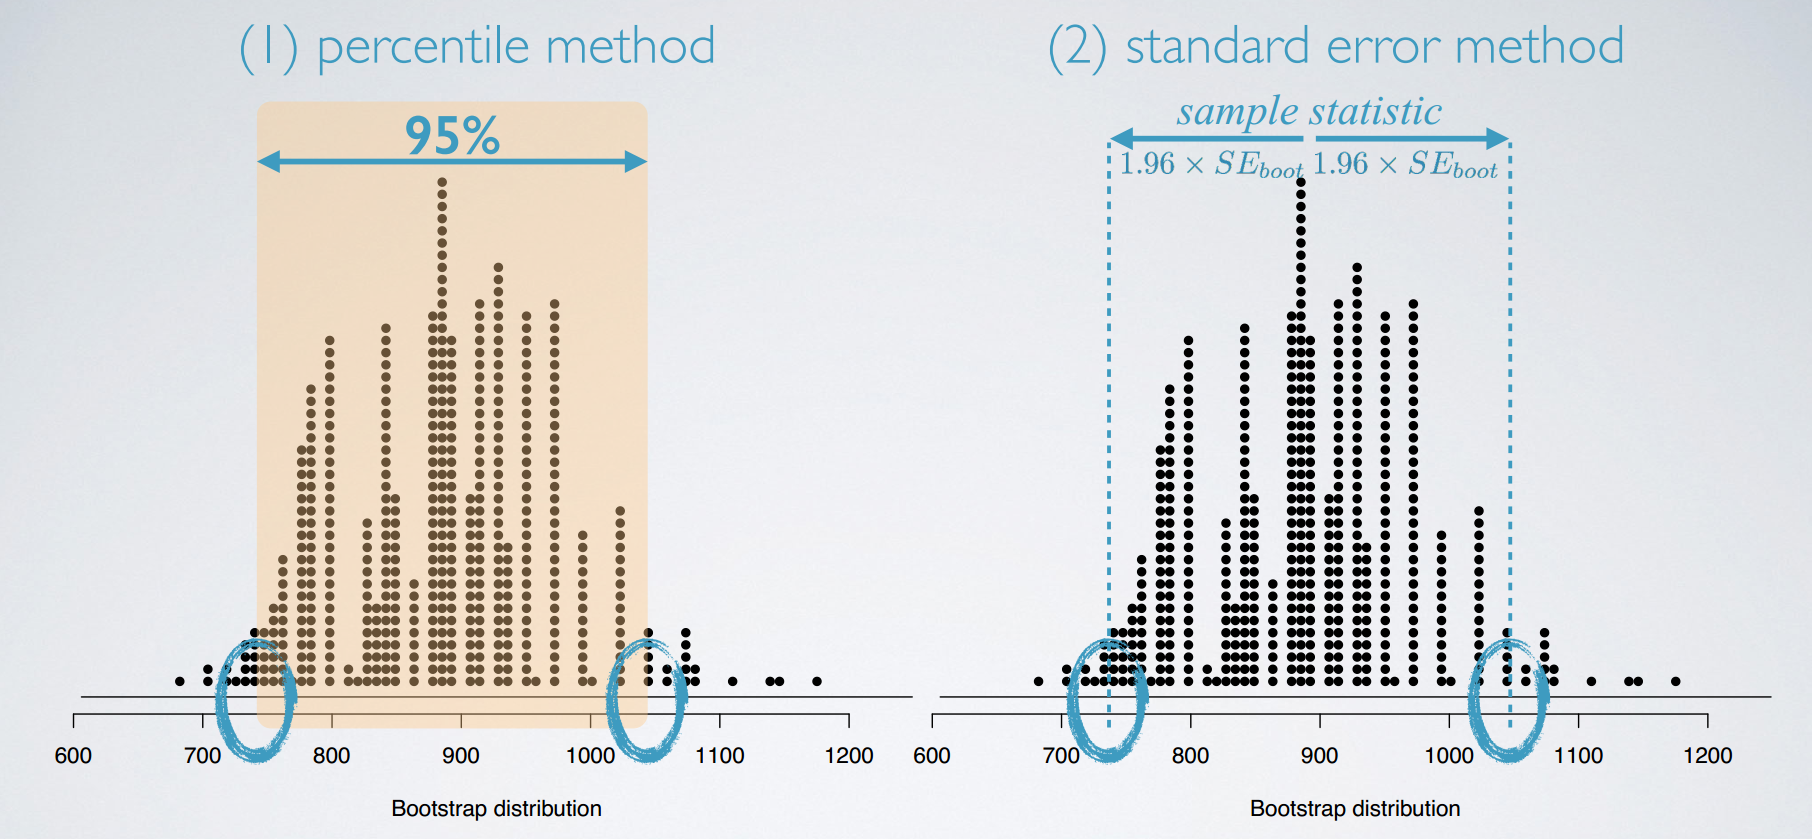
comparison: percentile vs. SE methods
bootstrapping limitations
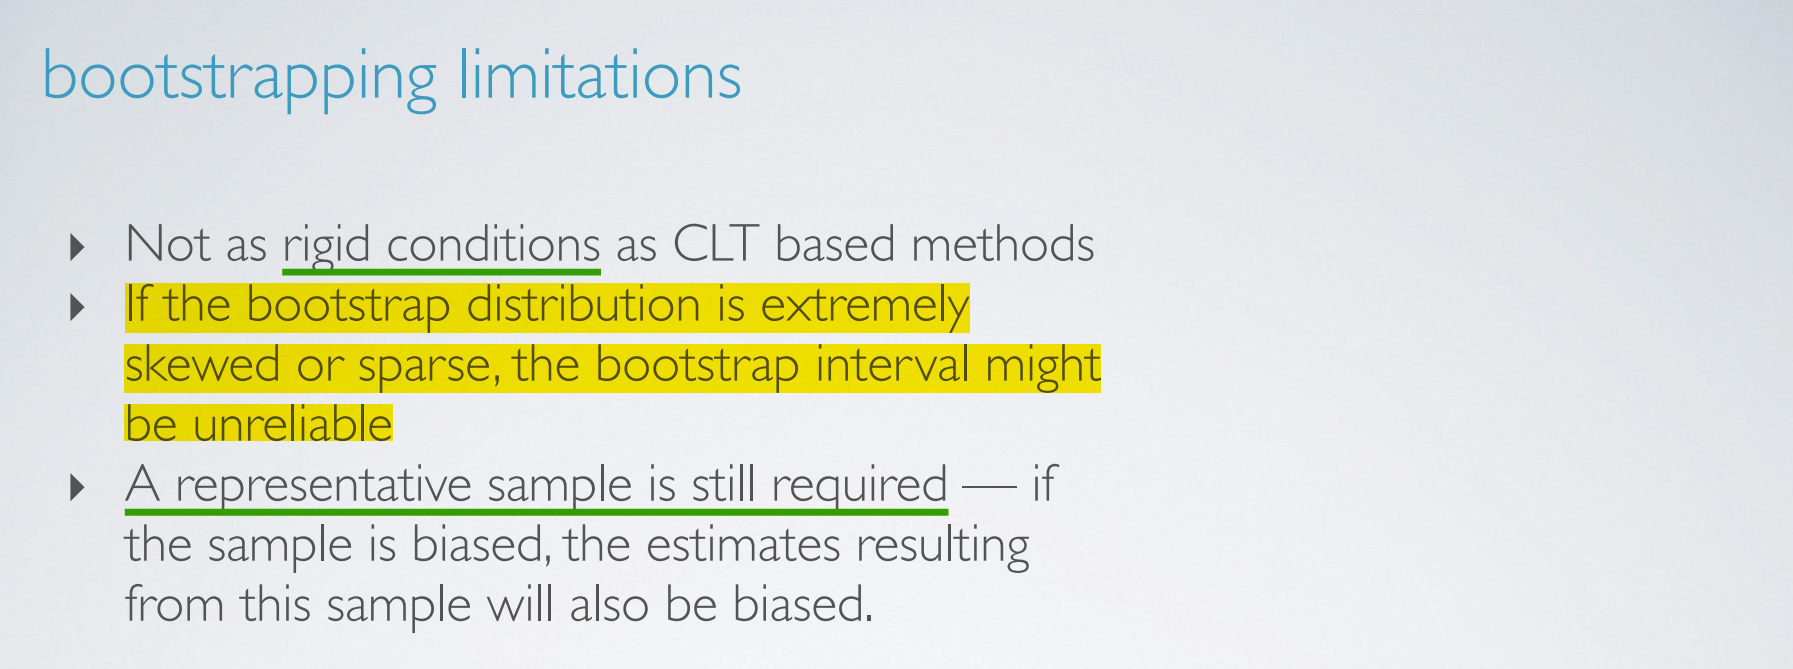
归根到底信息还是来源于给出的sample
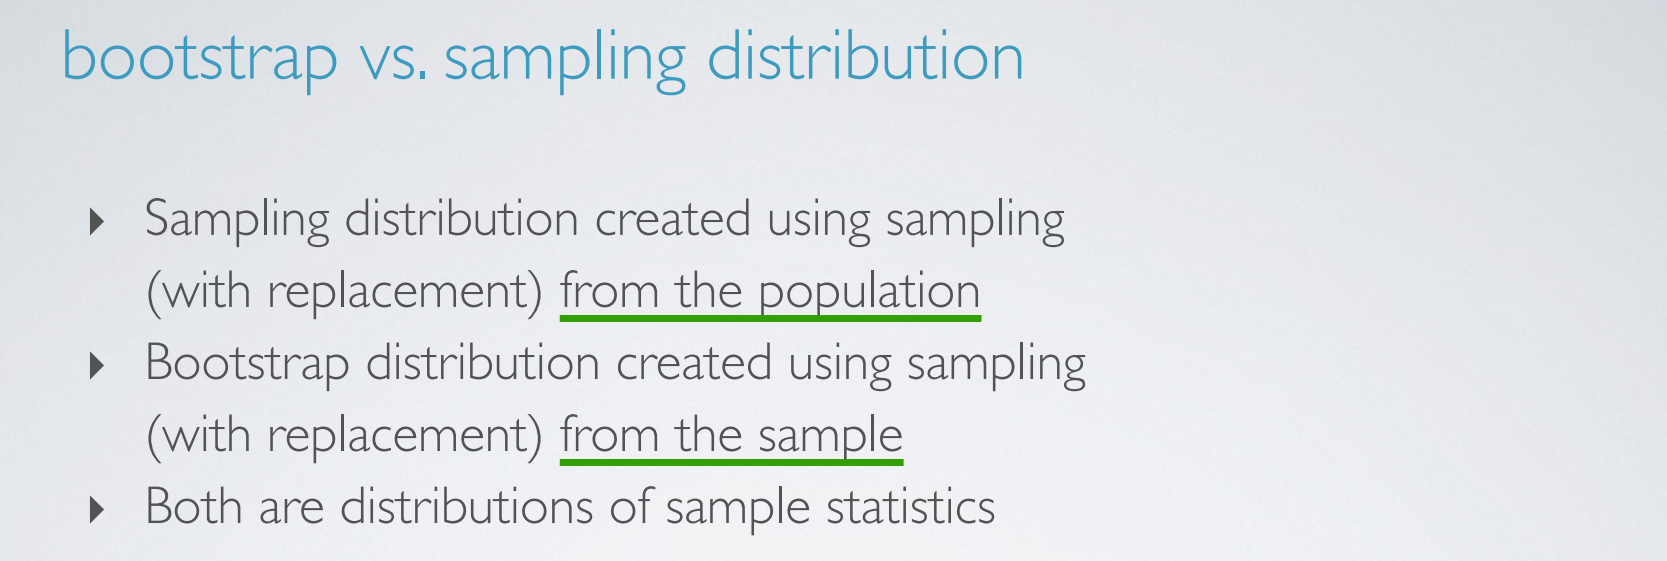
bootstrap vs. sampling distribution