@spiritnotes
2016-03-07T11:01:42.000000Z
字数 3078
阅读 4817
机器学习实践 -- Seeds数据集
机器学习实践
数据获取
该数据可以从uci中下载,通过pandas将其读入
path = 'seeds_dataset.txt'feature_names = ['area','perimeter','compactness','length-kernel','width-kernel','asymmetry-coefficient','length-kernel-groove']seeds = pd.read_table(path, header=None, names=feature_names + ['class'], sep='\s+')class_names = ['Kama', 'Rosa', 'Canadian']seeds = pd.concat([seeds[feature_names], pd.DataFrame([class_names[i-1] for i in list(seeds['class'])], columns=['class'])],axis=1)
清理分析
area perimeter compactness length-kernel width-kernel asymmetry-coefficient length-kernel-groovecount 210.000000 210.000000 210.000000 210.000000 210.000000 210.000000 210.000000mean 14.847524 14.559286 0.870999 5.628533 3.258605 3.700201 5.408071std 2.909699 1.305959 0.023629 0.443063 0.377714 1.503557 0.491480min 10.590000 12.410000 0.808100 4.899000 2.630000 0.765100 4.51900025% 12.270000 13.450000 0.856900 5.262250 2.944000 2.561500 5.04500050% 14.355000 14.320000 0.873450 5.523500 3.237000 3.599000 5.22300075% 17.305000 15.715000 0.887775 5.979750 3.561750 4.768750 5.877000max 21.180000 17.250000 0.918300 6.675000 4.033000 8.456000 6.550000
无缺失数据
可视化
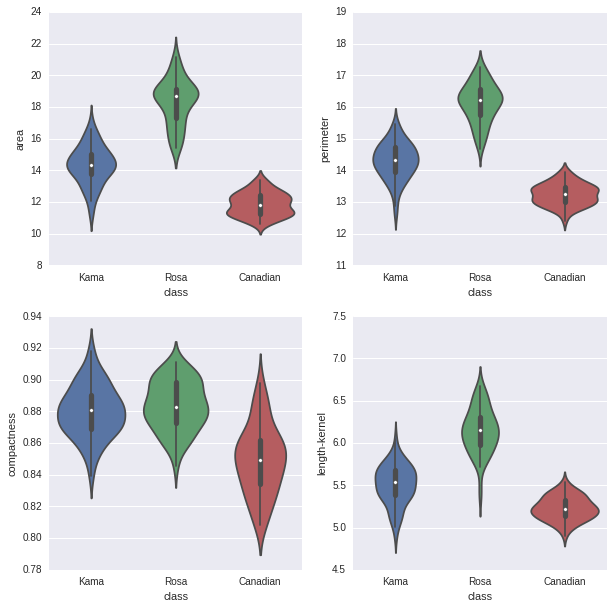
violinplot
从图上未发现异常。
for column_index, column in enumerate(feature_names):if column_index%4 == 0:plt.figure()plt.subplot(2, 2, column_index%4 + 1)sb.violinplot(x='class', y=column, data=seeds)

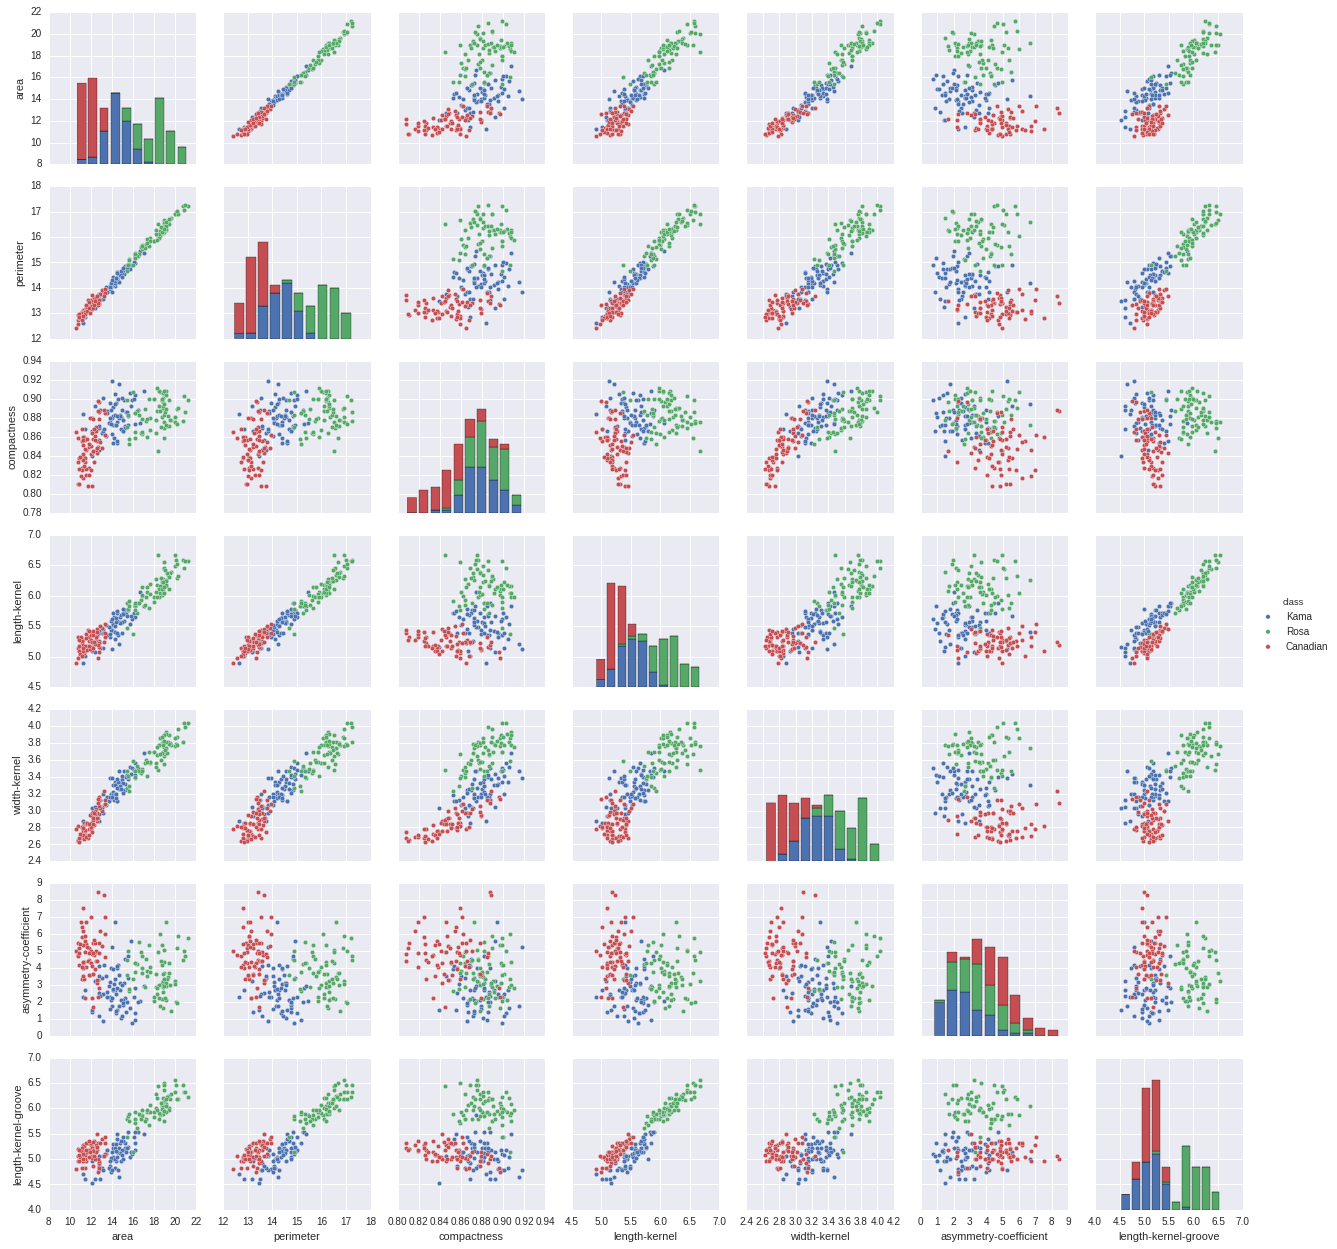
pairplot
从数据中可以看到有几个维度是完全相关的。
类别分布
三类数据样本个数一样。
| 类别 | 样本数 |
|---|---|
| Rosa | 70 |
| Canadian | 70 |
| Kama | 70 |
降维
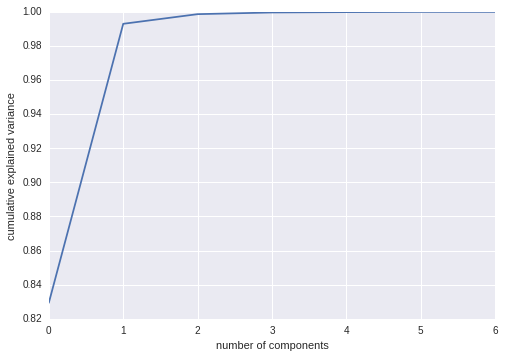
PCA
PCA降维为2后的图如下
能量分布如下
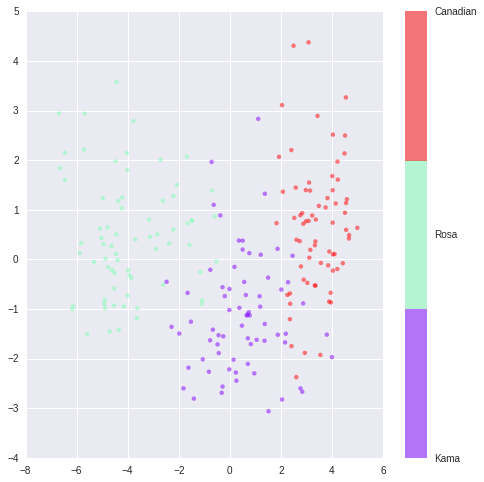
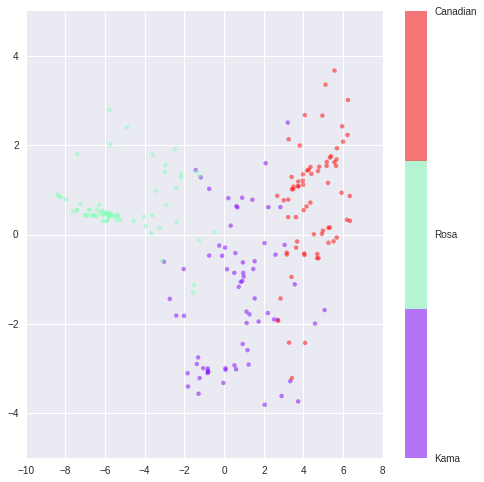
ISOMap
ISO降维分布如下
分类训练
KNN
求解结果为
(0.90476190476190477,KNeighborsClassifier(algorithm='auto', leaf_size=30, metric='minkowski',metric_params=None, n_jobs=1, n_neighbors=10, p=2,weights='distance'),{'n_neighbors': 10, 'weights': 'distance'})
决策树
求解结果为
(0.9285714285714286,DecisionTreeClassifier(class_weight=None, criterion='gini', max_depth=30,max_features=None, max_leaf_nodes=None, min_samples_leaf=2,min_samples_split=8, min_weight_fraction_leaf=0.0,presort=False, random_state=None, splitter='best'),{'criterion': 'gini','max_depth': 30,'min_samples_leaf': 2,'min_samples_split': 8})
逻辑回归
求解结果为
(0.94761904761904758,LogisticRegression(C=10, class_weight=None, dual=False, fit_intercept=True,intercept_scaling=1, max_iter=100, multi_class='ovr', n_jobs=1,penalty='l2', random_state=None, solver='liblinear', tol=0.0001,verbose=0, warm_start=False),{'C': 10})
SVM
求解最佳结果为
(0.94761904761904758, SVC(C=1, cache_size=200, class_weight=None, coef0=0.0,decision_function_shape=None, degree=3, gamma='auto', kernel='poly',max_iter=-1, probability=False, random_state=None, shrinking=True,tol=0.001, verbose=False), {'C': 1, 'kernel': 'poly'})
随机森林
求解结果为
(0.92380952380952386,RandomForestClassifier(bootstrap=True, class_weight=None, criterion='gini',max_depth=None, max_features='auto', max_leaf_nodes=None,min_samples_leaf=1, min_samples_split=2,min_weight_fraction_leaf=0.0, n_estimators=150, n_jobs=1,oob_score=False, random_state=0, verbose=0, warm_start=False),{'n_estimators': 150})
汇总
从汇总数据上看,模型切合最好的是逻辑回归。
| Classifier | Mean Score | Std |
|---|---|---|
| KNeighborsClassifier | 0.9048 | 0.0904 |
| DecisionTreeClassifier | 0.9286 | 0.0714 |
| LogisticRegression | 0.9476 | 0.0497 |
| SVC | 0.9476 | 0.0781 |
| RandomForestClassifier | 0.9238 | 0.0802 |
针对单次测试,可看到如下混淆矩阵,Kama和Rosa之间有误差。具体出现错误和样本选择划分测试集有关。
| 实际\预测 | Kama | Rosa | Canadian |
|---|---|---|---|
| Kama | 12 | 1 | 0 |
| Rosa | 1 | 15 | 0 |
| Canadian | 0 | 0 | 13 |
代码
Github: https://github.com/spiritwiki/codes/tree/master/data_seeds
