@agpwhy
2021-06-22T07:25:38.000000Z
字数 2173
阅读 339
王胖的生信笔记10:一些看着没啥用的细枝末节
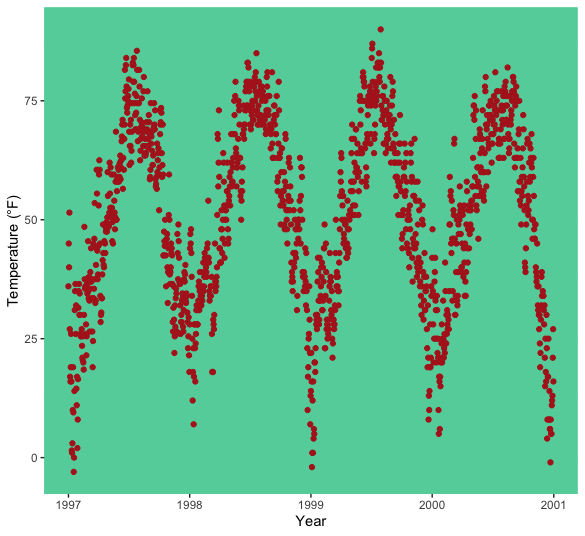
首先看下怎么换图片背景色
ggplot(chic, aes(x = date, y = temp)) + geom_point(color = "#1D8565", size = 2) + labs(x = "Year", y = "Temperature (°F)") + theme(panel.background = element_rect( fill = "#64D2AA", color = "#64D2AA", size = 2) )
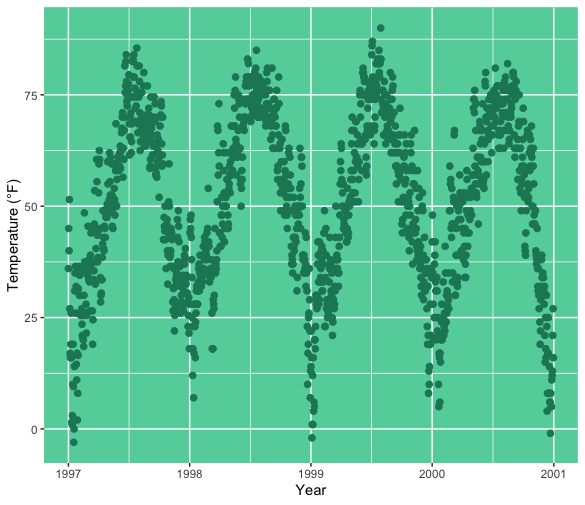
把图标的换成原谅色
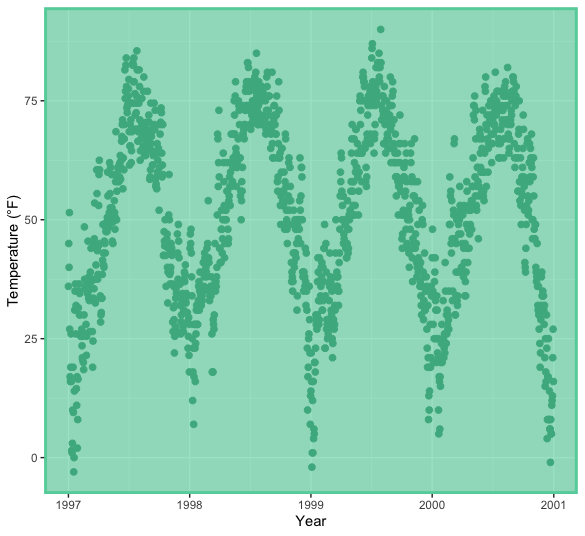
其实在panel.background之上还有一层panel.border。但是这一层一定要留一点透明,否则的话你的点就要被遮盖掉了。
看一看留了一点透明的情况下是什么效果。
ggplot(chic, aes(x = date, y = temp)) + geom_point(color = "#1D8565", size = 2) + labs(x = "Year", y = "Temperature (°F)") + theme(panel.border = element_rect( fill = "#64D2AA99", color = "#64D2AA", size = 2) )
这时候有人要喊不满意了,为啥只有做图区域是原谅色,我全都想要变成原谅色。安排一下。
就是在panel.background之外设置一下plot.background。两者设置成一样的,或者把panel.background这是为NA。
ggplot(chic, aes(x = date, y = temp)) + geom_point(color = "firebrick") + labs(x = "Year", y = "Temperature (°F)") + theme(panel.background = element_rect(fill = NA), plot.background = element_rect(fill = "#64D2AA", color = "#64D2AA", size = 2))
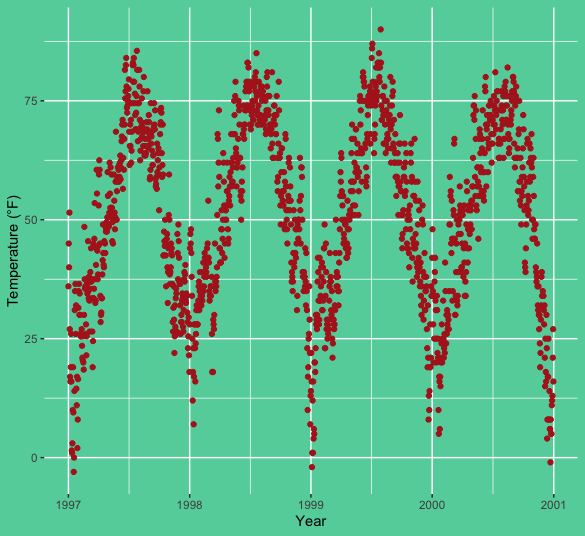
注意下plot.background设置里面,第一个fill是背景色,第二个color是边框色。
顺便讲下设置背景的时候,怎么留白。需要先装一下grid这个工具包。
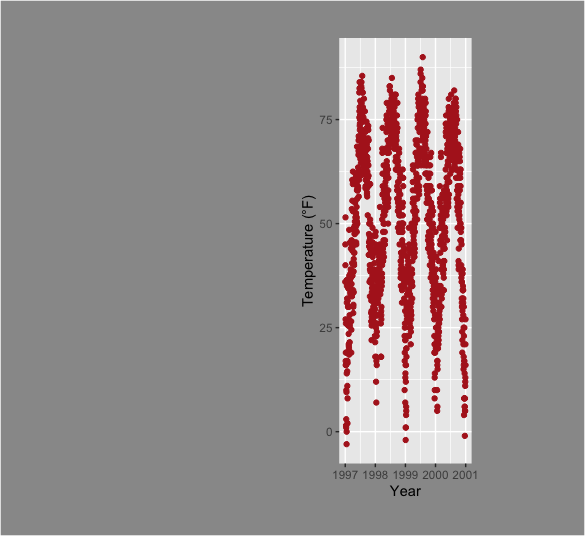
ggplot(chic, aes(x = date, y = temp)) + geom_point(color = "firebrick") + labs(x = "Year", y = "Temperature (°F)") + theme(plot.background = element_rect(fill = "gray60"), plot.margin = margin(t = 1, r = 3, b = 1, l = 8, unit = "cm"))
这个会在下一期,如何在一个页面上放多个图中用到。
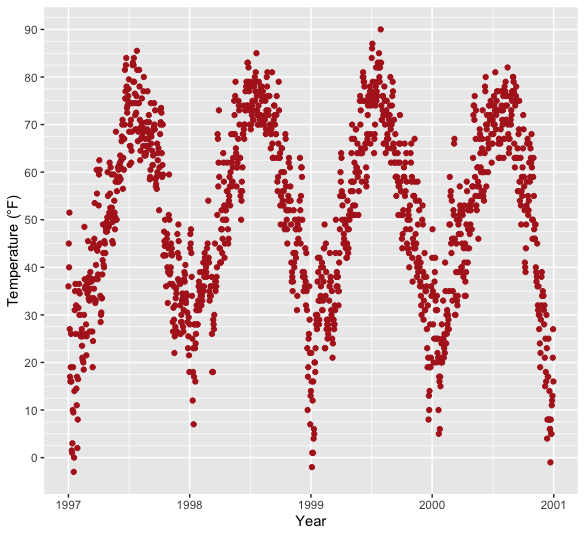
再看下怎么换网格线
在开始的第一张图上可以看到网格线其实也分为大的网格线(与坐标轴上每个刻度垂直的线)和小的网格线(大的网格线之间的线)。
一起设置的话,是panel.grid、分开设置的话是panel.grid.major 和 panel.grid.minor。
ggplot(chic, aes(x = date, y = temp)) + geom_point(color = "firebrick") + labs(x = "Year", y = "Temperature (°F)") + theme(panel.grid.major = element_line(color = "#64D2AA", size = .5), panel.grid.minor = element_line(color = "#64D2AA", size = .25), panel.background = element_rect(fill = "#64D2AA", color = "#64D2AA", size = 2))
这样一设置,是不是网格线也变成原谅色了。
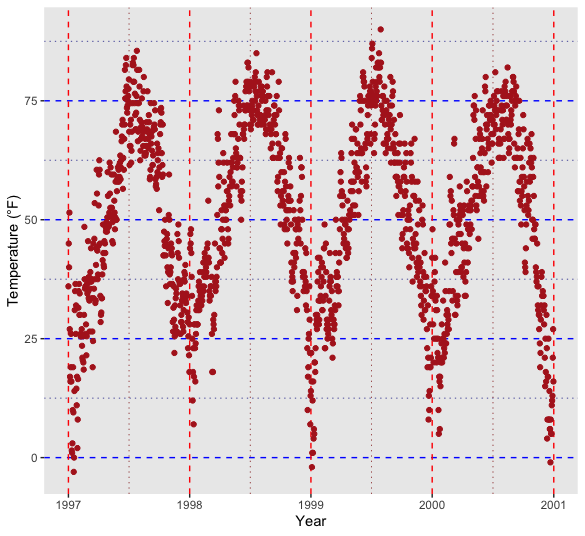
当然还可以分别设置颜色+样式
ggplot(chic, aes(x = date, y = temp)) + geom_point(color = "firebrick") + labs(x = "Year", y = "Temperature (°F)") + theme(panel.grid.major = element_line(size = .5, linetype = "dashed"), panel.grid.minor = element_line(size = .25, linetype = "dotted"), panel.grid.major.x = element_line(color = "red1"), panel.grid.major.y = element_line(color = "blue1"), panel.grid.minor.x = element_line(color = "red4"), panel.grid.minor.y = element_line(color = "blue4"))
或者完全不显示网格线(设置为element_blank())

还可以设置网格线之间的间格(分开设置大的和小的)
ggplot(chic, aes(x = date, y = temp)) + geom_point(color = "firebrick") + labs(x = "Year", y = "Temperature (°F)") + scale_y_continuous(breaks = seq(0, 100, 10), minor_breaks = seq(0, 100, 2.5))