@agpwhy
2021-08-13T08:32:24.000000Z
字数 2258
阅读 404
王胖的生信笔记第15期:加点字
距离上次鸽了好久。具体原因按下不表,总之是我不好,在此道歉。
接着把ggplot2的一些内容说完吧。也快讲完了。
这次讲讲如何不用ps,不用软件,直接在R里面给图片上加点字。
标记点
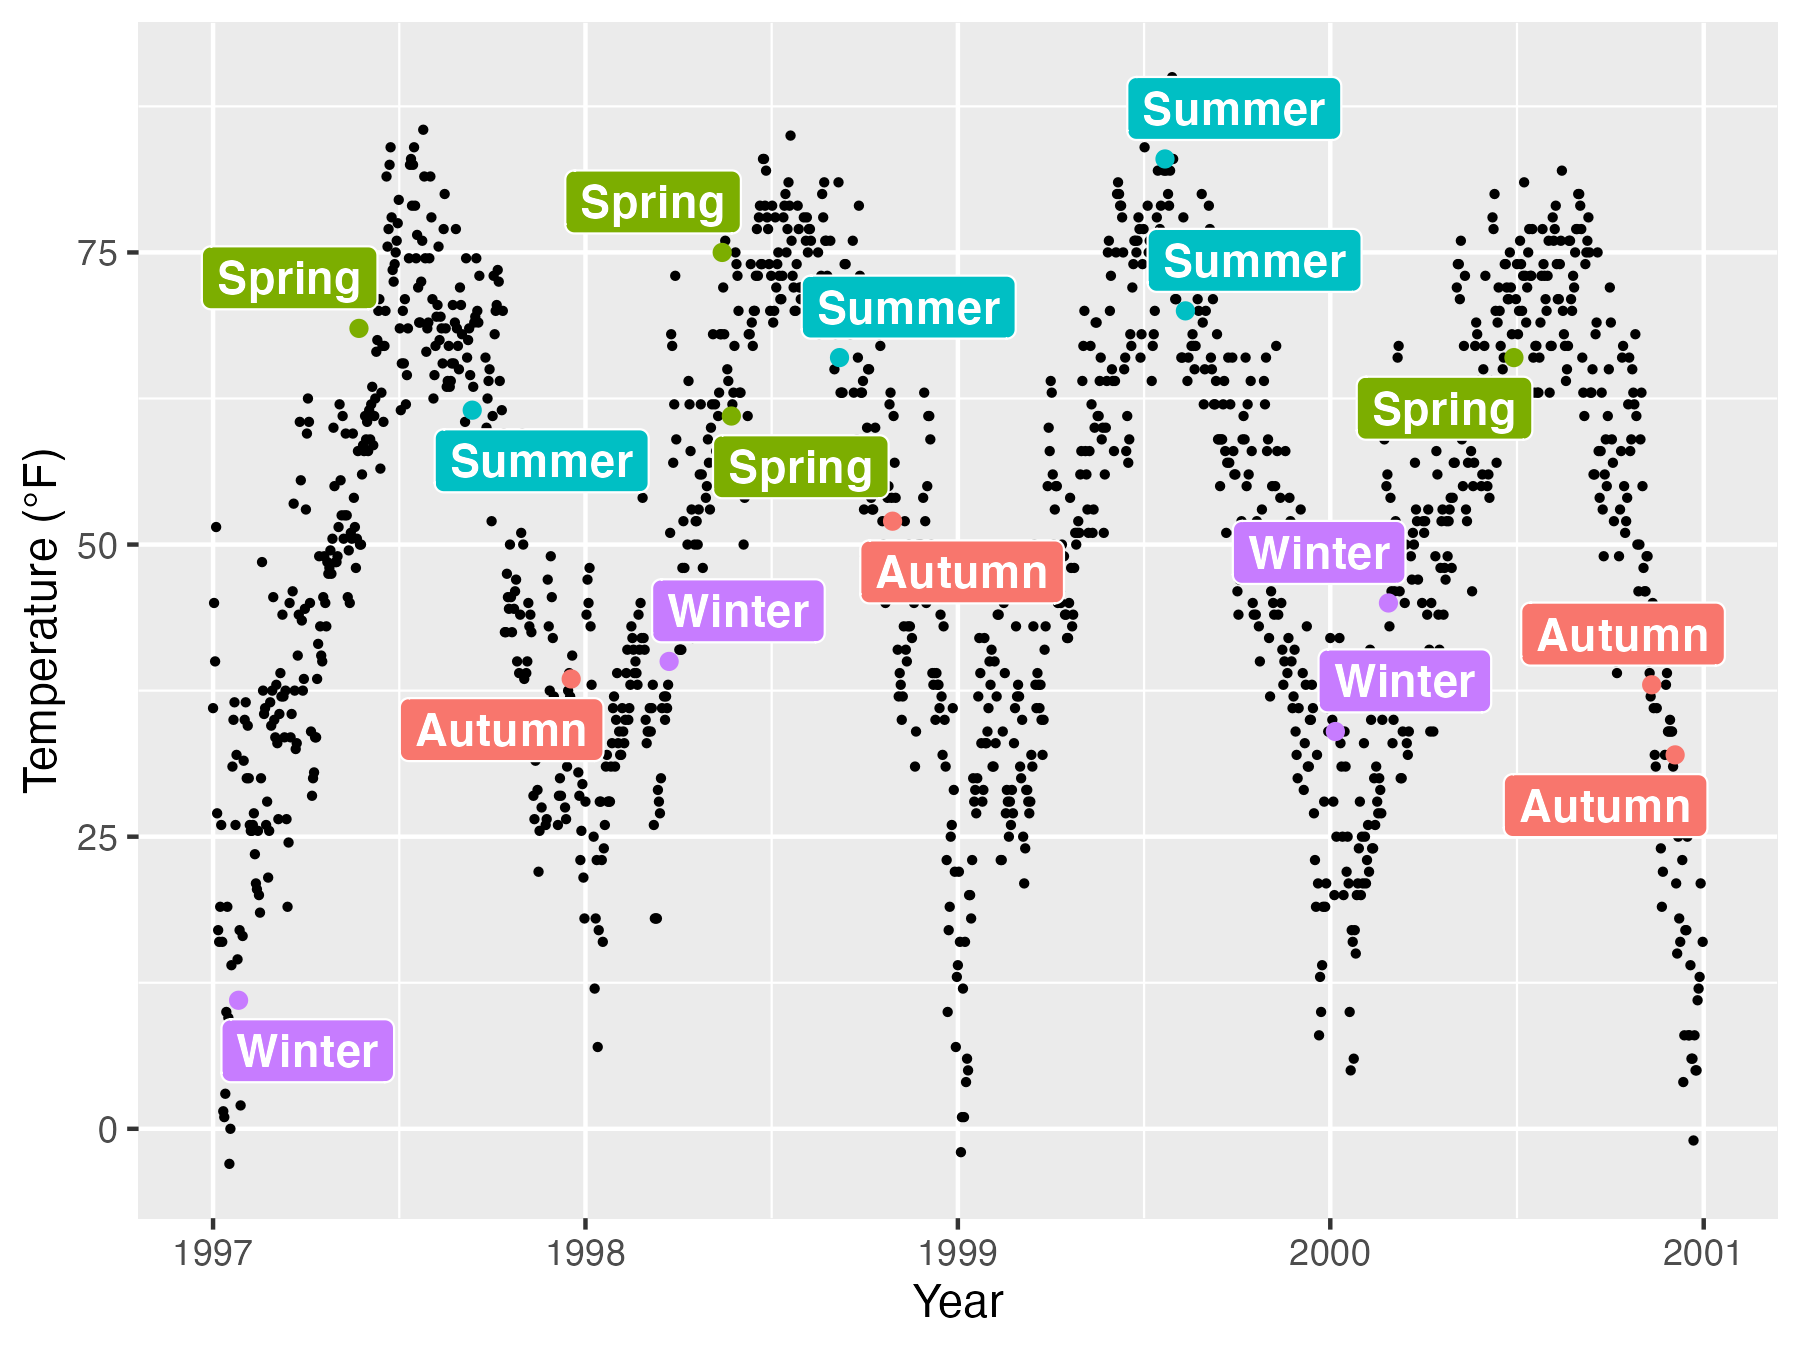
首先先搞点最简单的,每个都上个文字标记。
sample <- chic %>% dplyr::group_by(season) %>% dplyr::sample_frac(0.01)
先只用1%的数据。
ggplot(sample, aes(x = date, y = temp, color = season)) + geom_point() + geom_label(aes(label = season), hjust = .5, vjust = -.5) + labs(x = "Year", y = "Temperature (°F)") + xlim(as.Date(c('1997-01-01', '2000-12-31'))) + ylim(c(0, 90)) + theme(legend.position = "none")
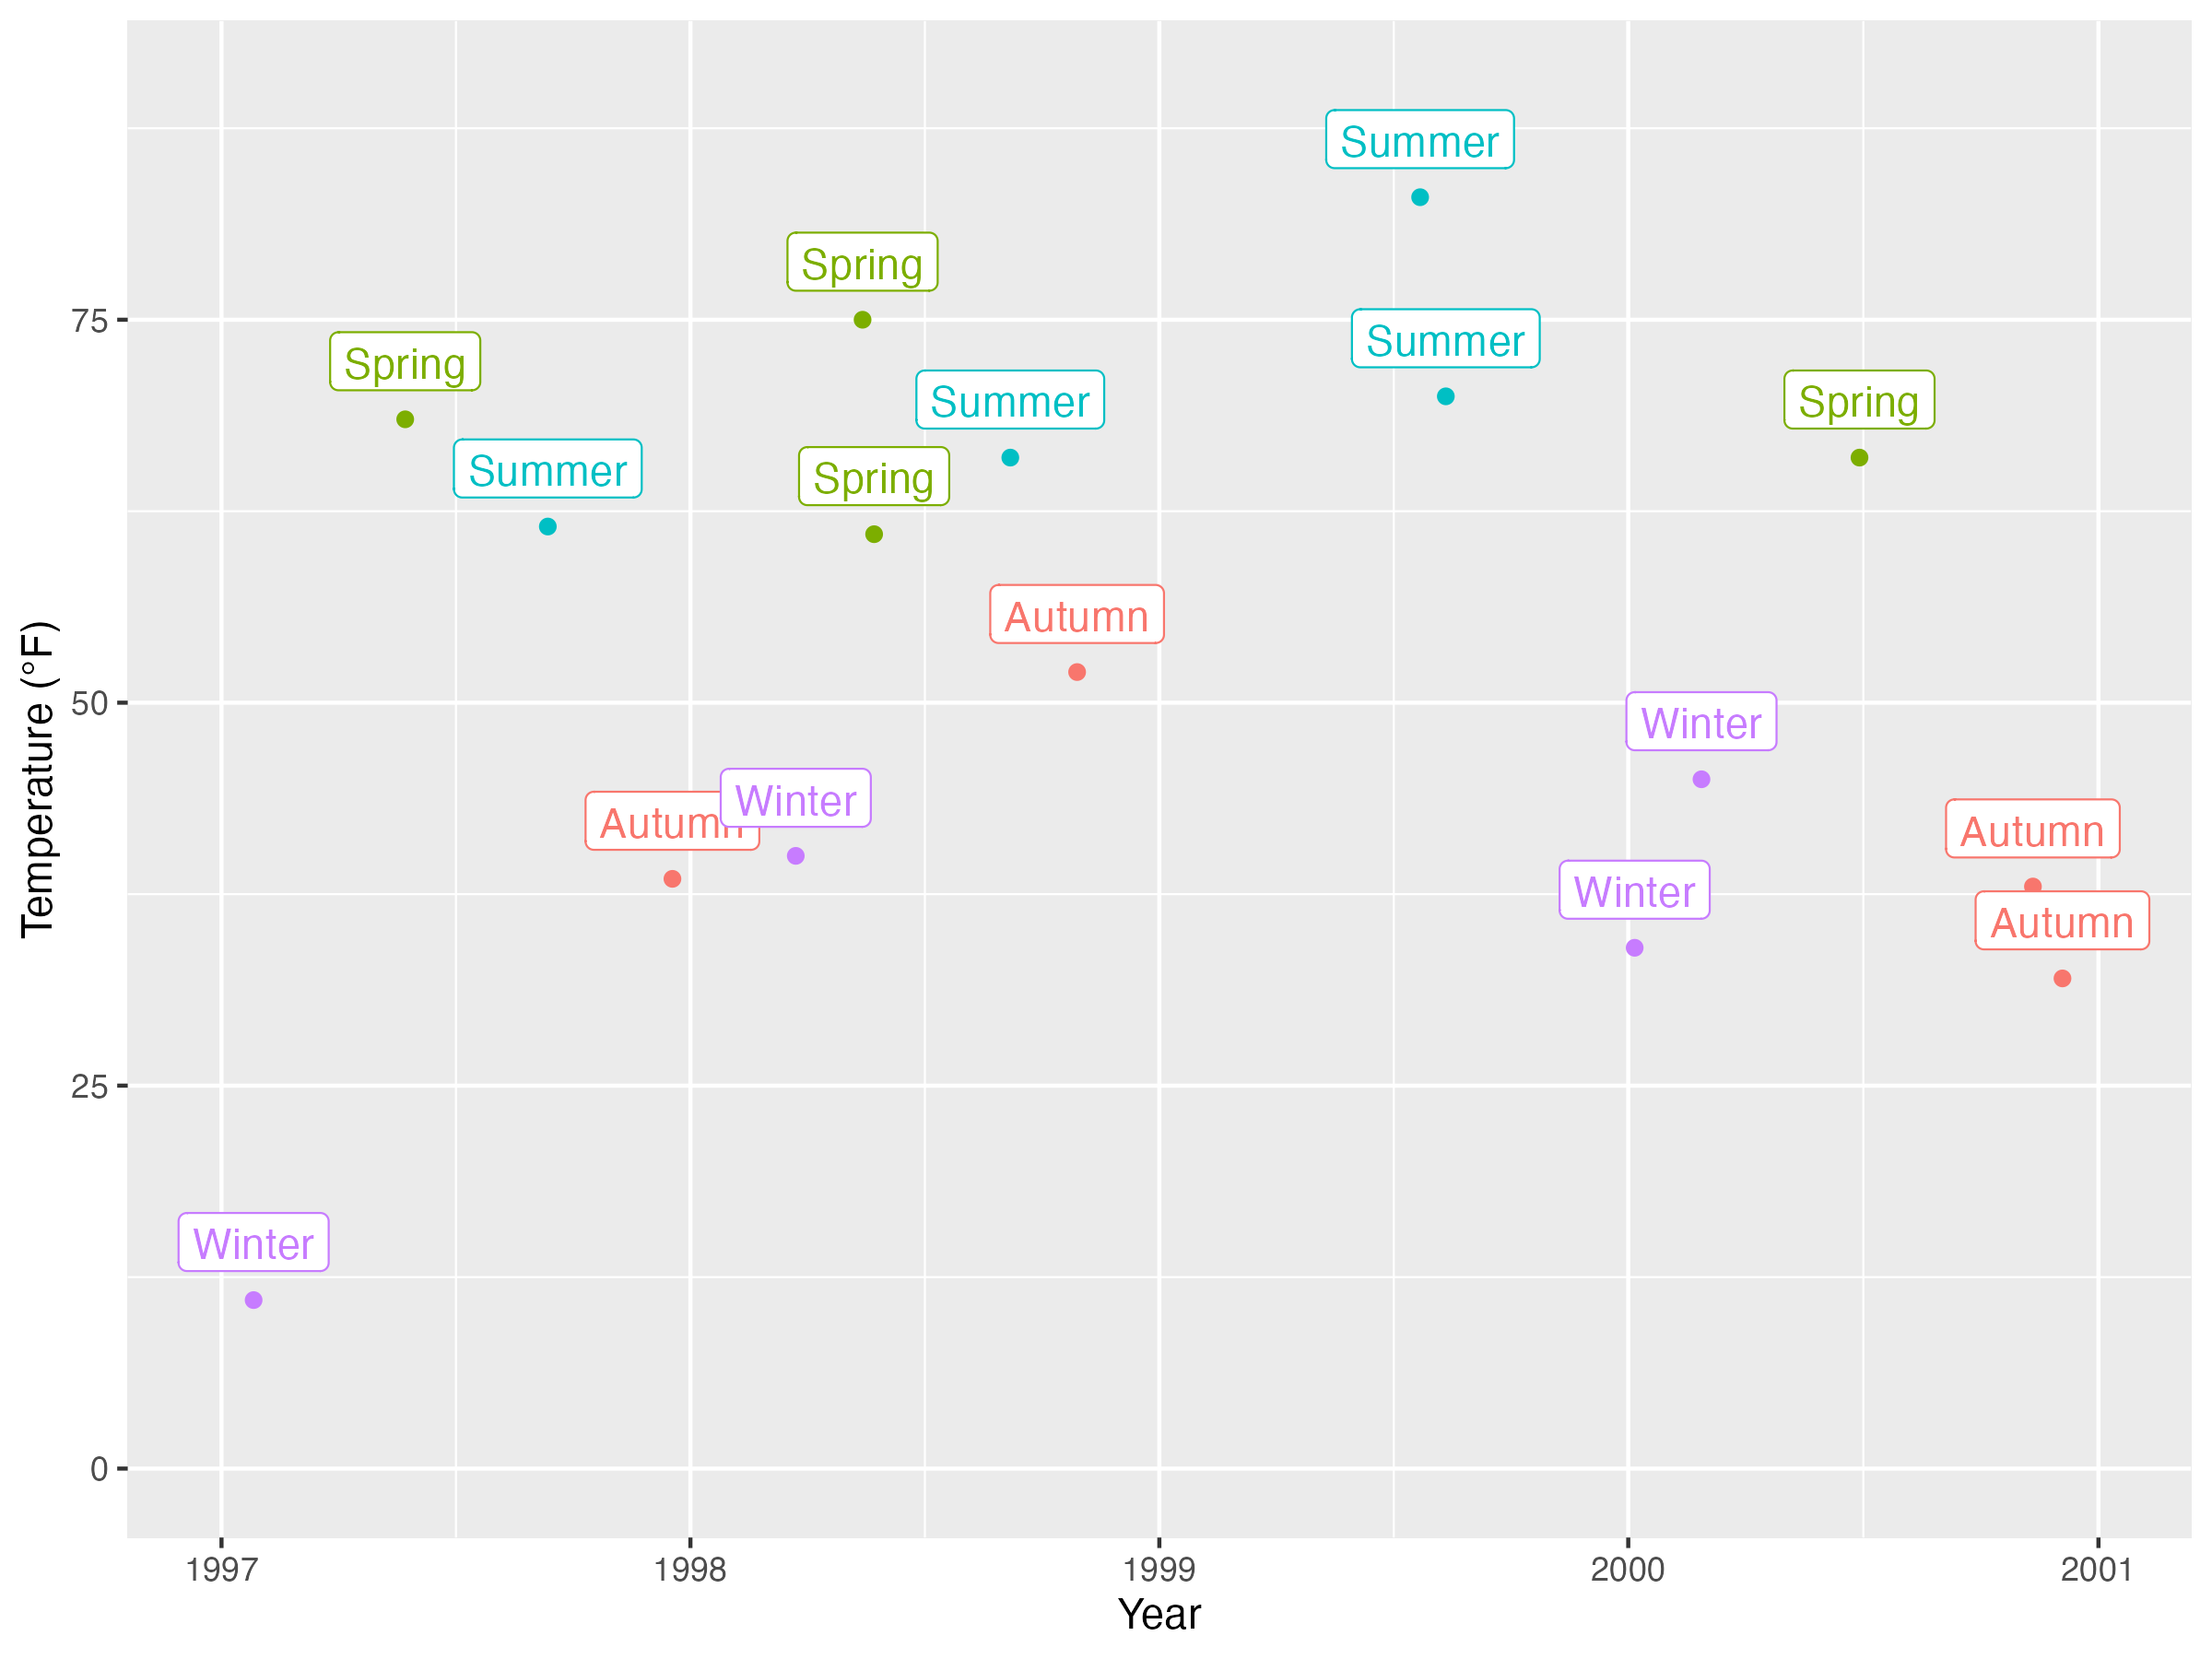
标记有重叠,就需要把geom_label使用ggrepel包里的geom_label_repel来代替
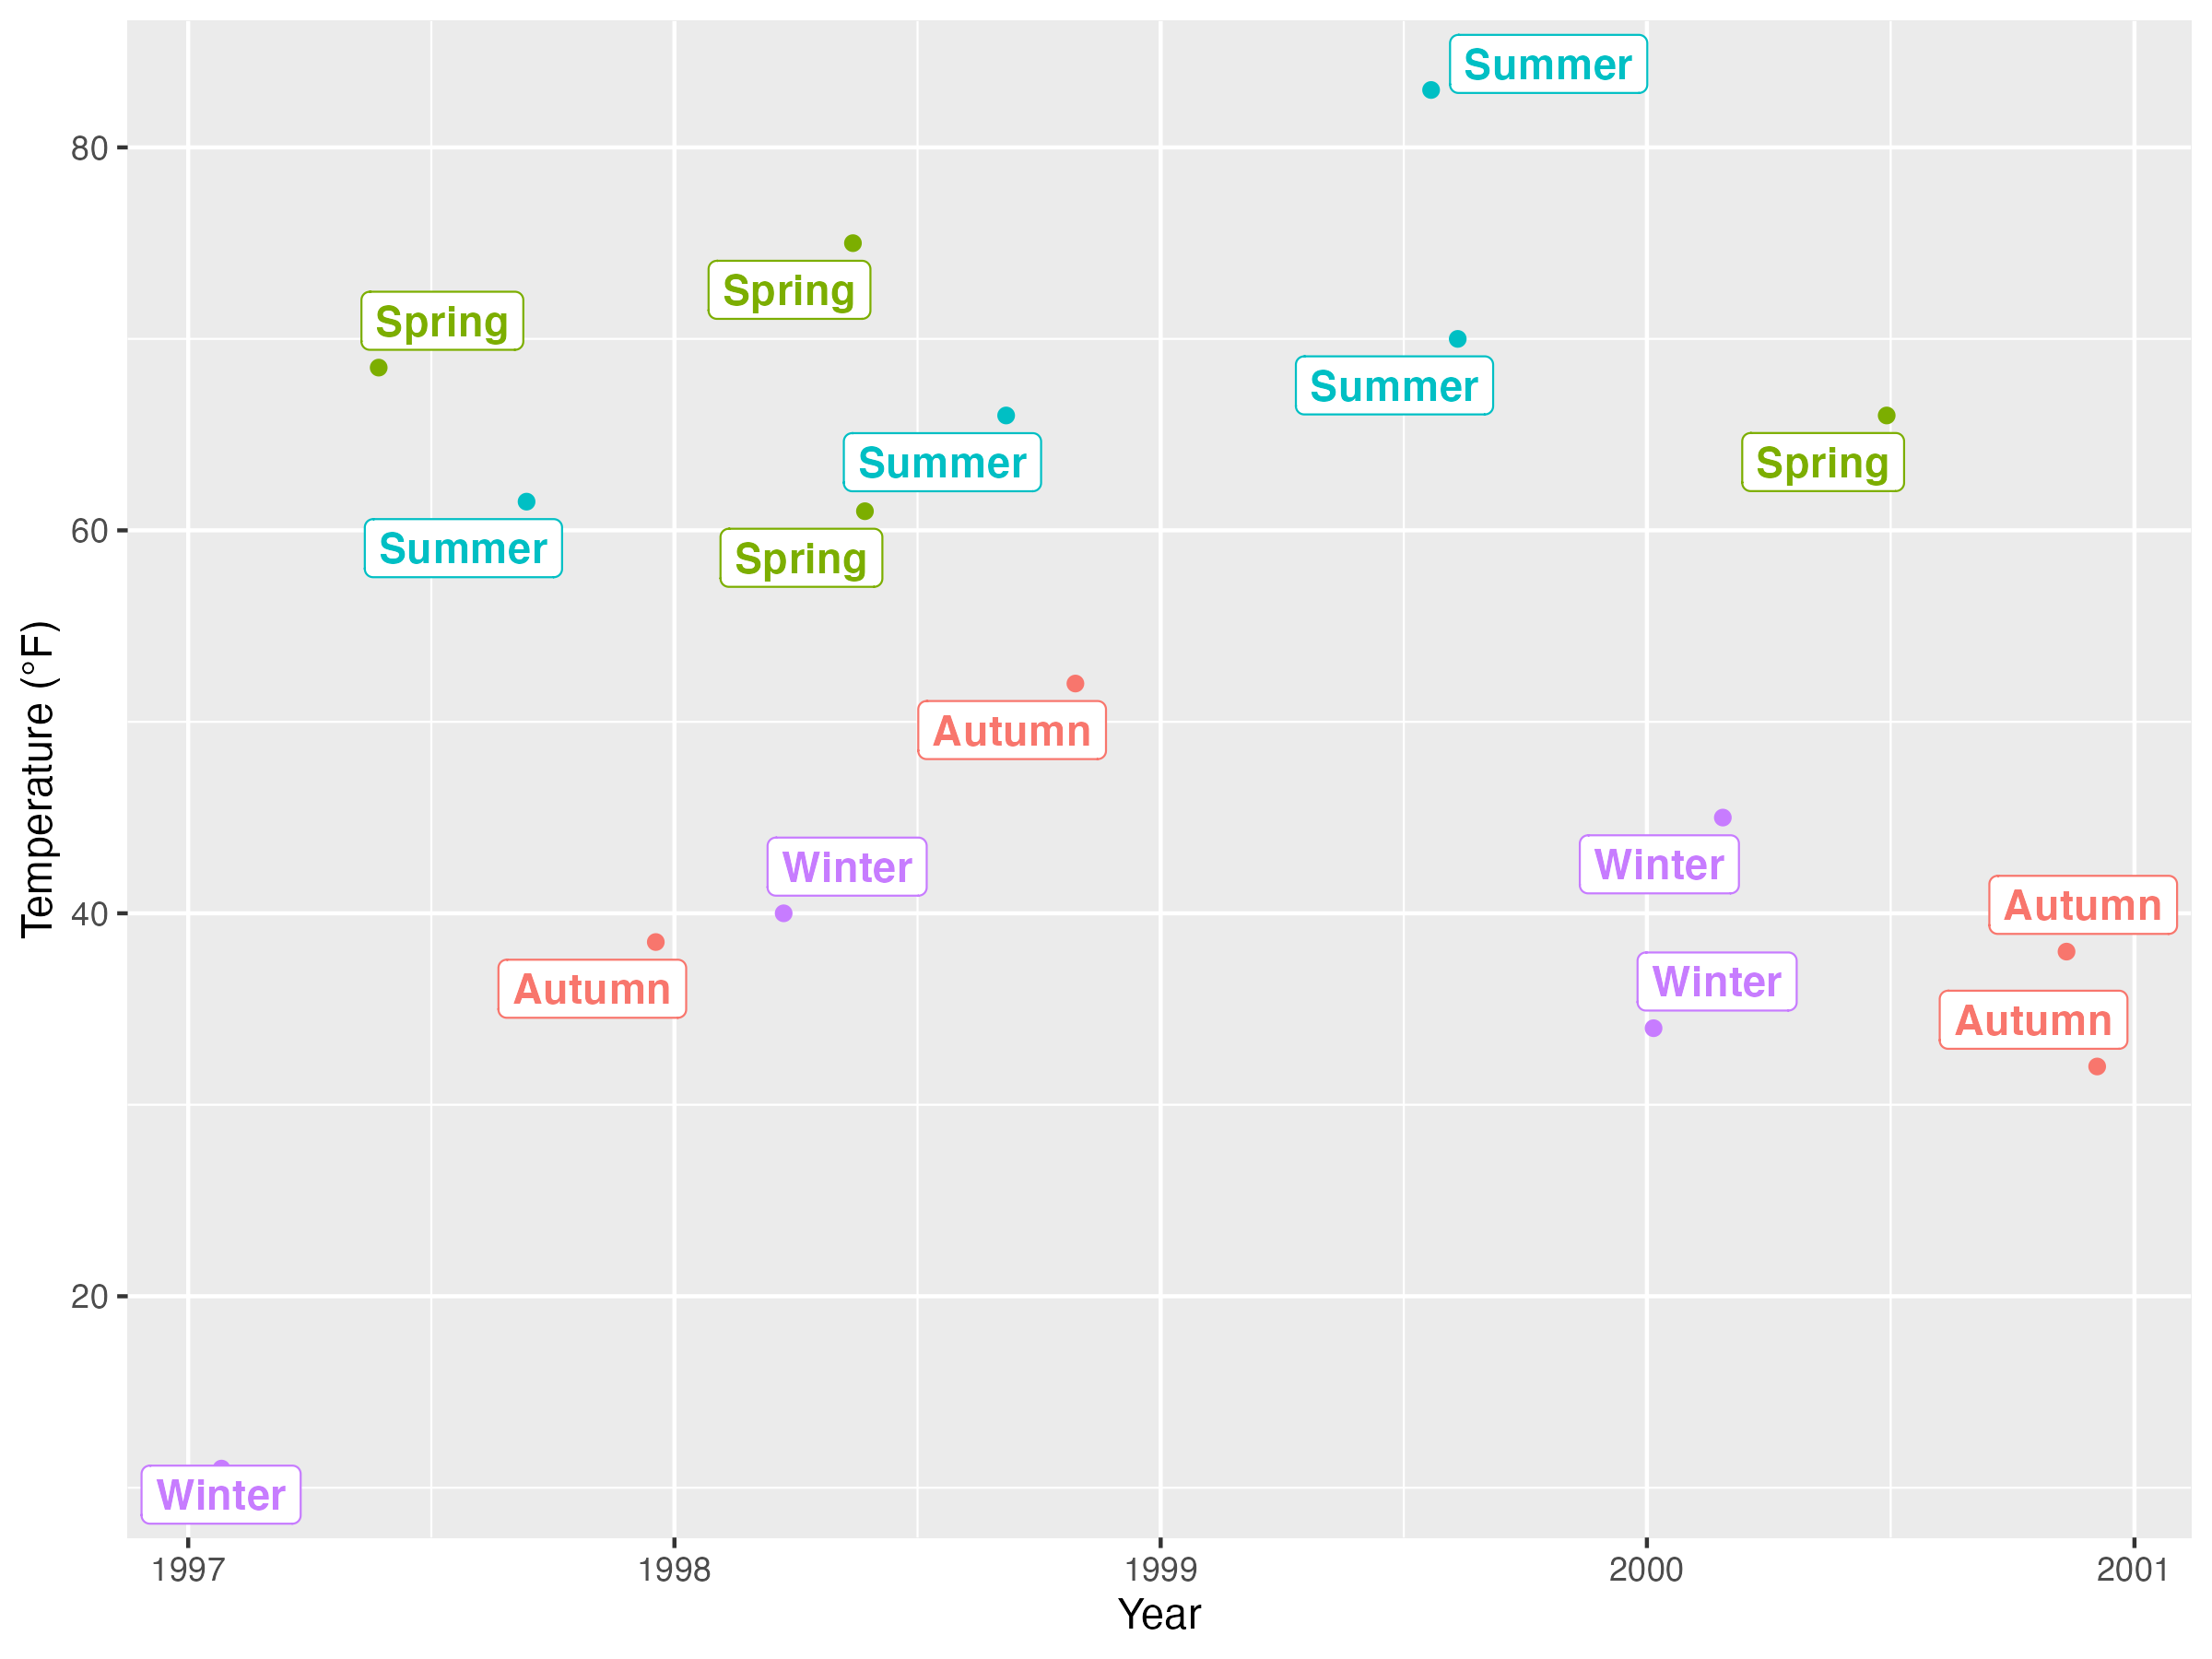
那这样不是有问题嘛?其他的点没有了呀,那怎么办呢?
没关系。
ggplot(sample, aes(x = date, y = temp)) + geom_point(data = chic, size = .5) + geom_point(aes(color = season), size = 1.5) + geom_label_repel(aes(label = season, fill = season), color = "white", fontface = "bold", segment.color = "grey30") + labs(x = "Year", y = "Temperature (°F)") + theme(legend.position = "none")
注意里面第一个geom_point是等于在原来的图像上覆盖了再做一次图。
然后第二个geom_point是给最早的那些点上色。后面都是类似的。segment.color是指的连接label和标记点之间线段颜色的参数。
geom_text_repel方法类似。
上点文字段落
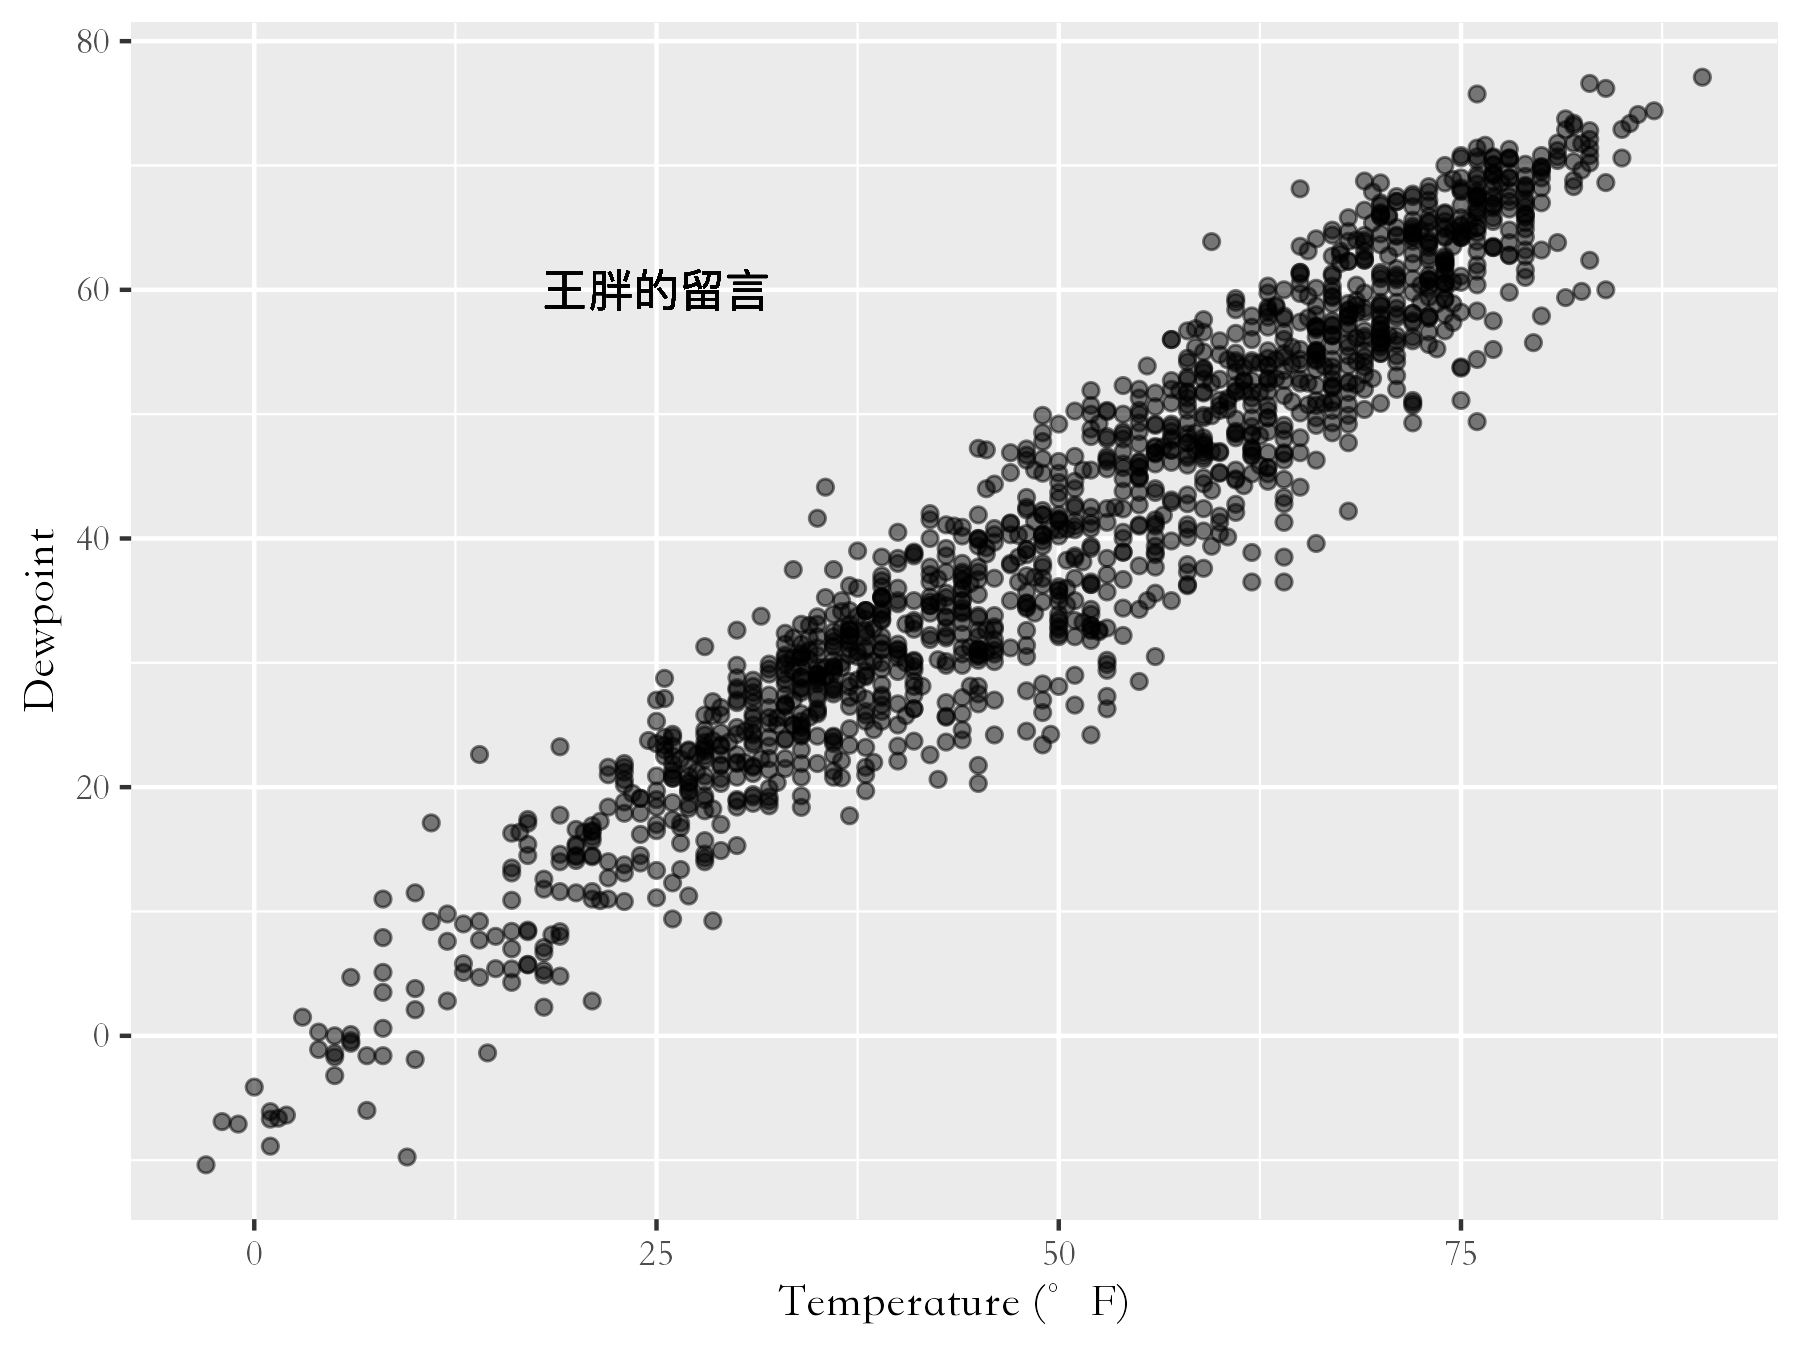
g <- ggplot(chic, aes(x = temp, y = dewpoint)) + geom_point(alpha = .5) + labs(x = "Temperature (°F)", y = "Dewpoint")
g + geom_text(aes(x = 25, y = 60, label = "This is a useful annotation"))
这个你看没有加粗体就很粗,这是为啥呢,因为这是每画一个点,就要写一次label。
geom_text(aes(x = 25, y = 60, label = "王胖的留言"),stat = "unique")
这样设置就好了

再加点花的。
p <- g + geom_text(aes(x = 25, y = 60, label = "王胖的留言"),stat = "unique",family = "STSong",size = 7, color = "darkcyan")
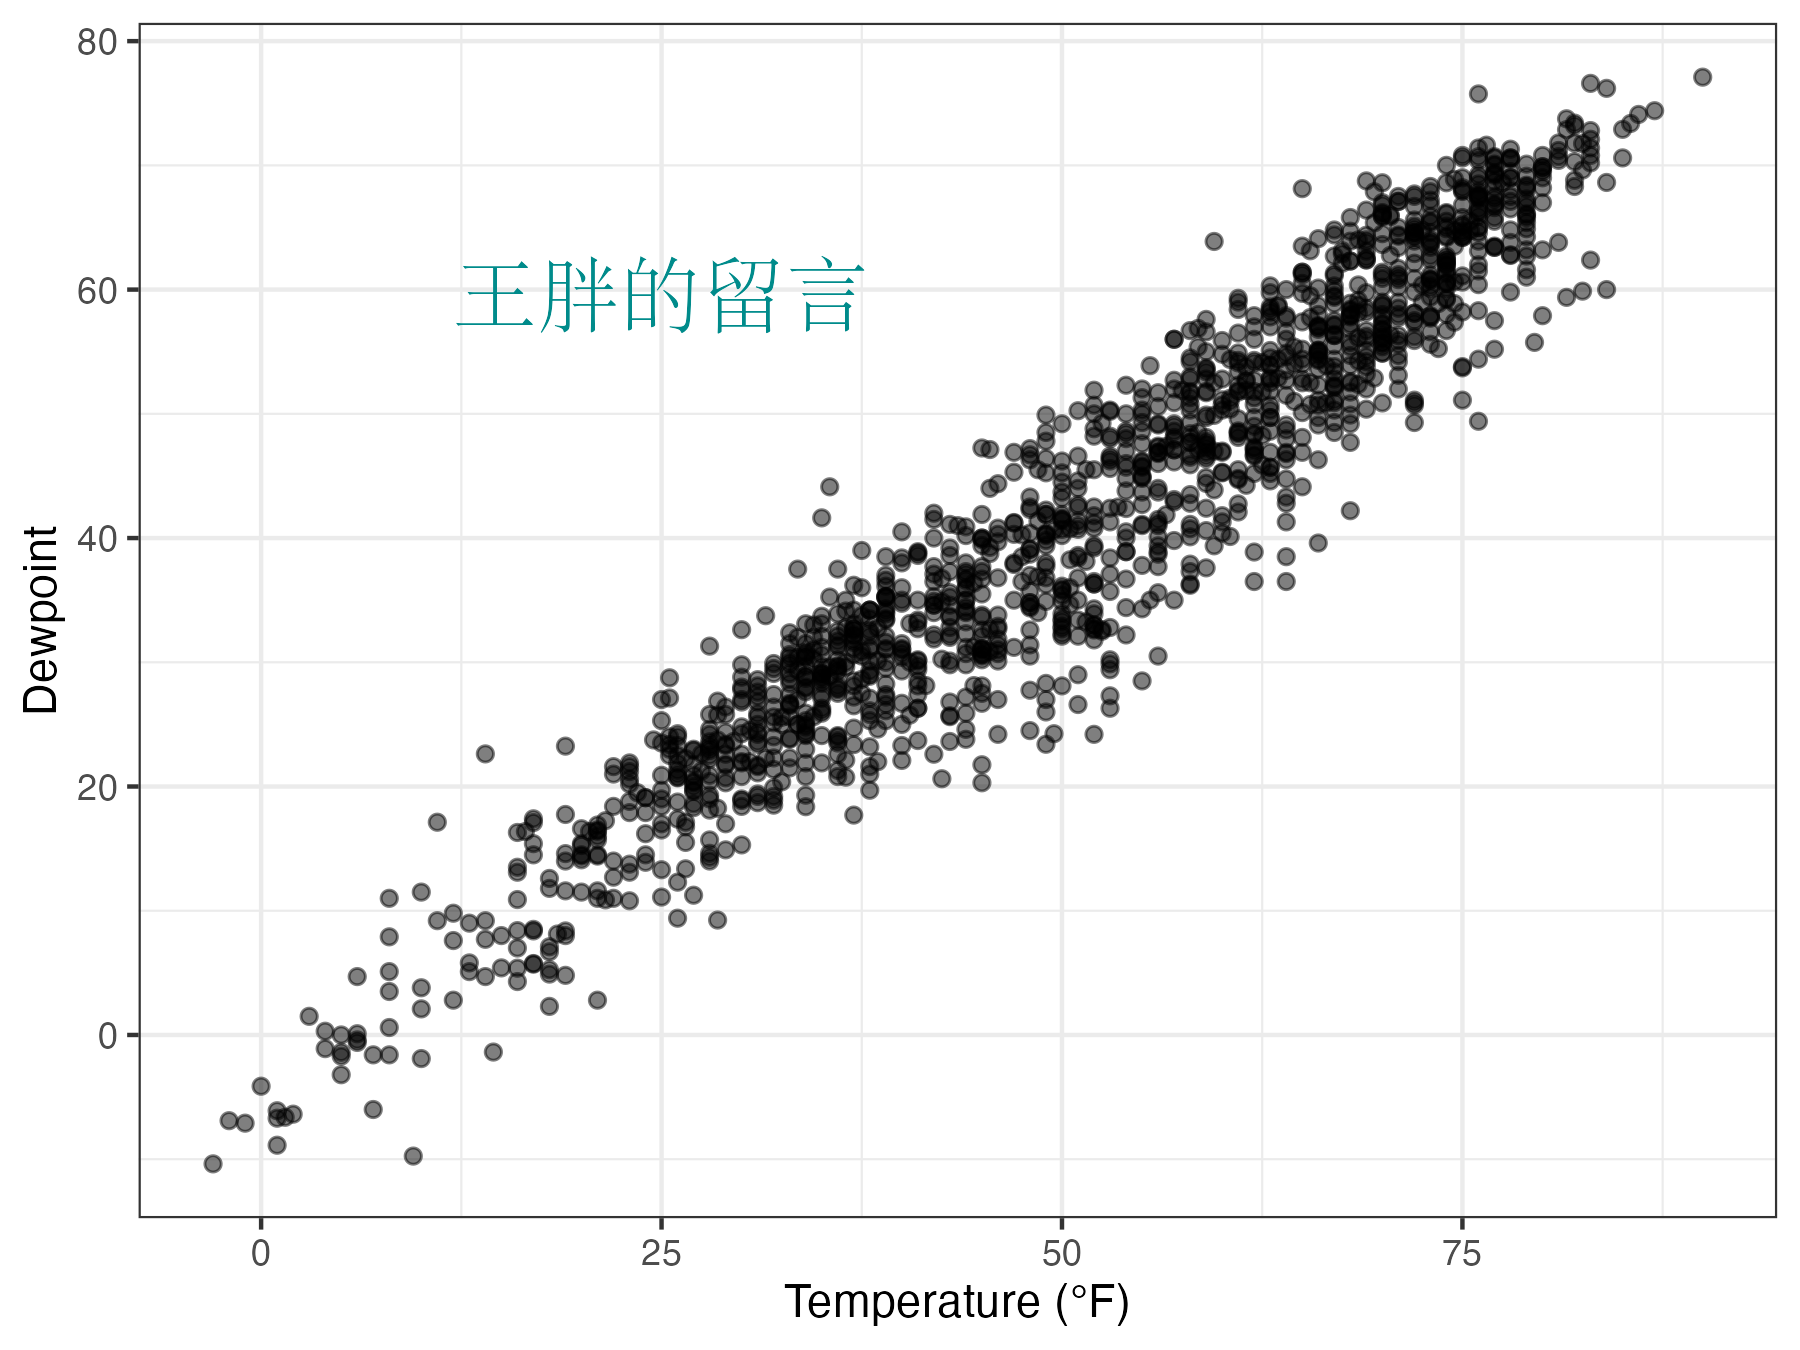
当然如果涉及到分面的图。这种就太复杂了(因为每个位置需要分开调整),我觉得你还是找个软件后期再加吧。以备有些人需要,我把资料写在这。
library(tidyverse)
ann <- chic %>% group_by(season) %>% summarize(o3 = min(o3, na.rm = TRUE) + (max(o3, na.rm = TRUE) -min(o3, na.rm = TRUE)) / 2))
g <- ggplot(chic, aes(x = o3, y = temp)) + geom_point() + labs(x = "Ozone", y = "Temperature (°F)")
g + geom_text(data = ann, aes(x = o3, y = 97, label = "比较炫酷的"), size = 5, family="STSong") + scale_y_continuous(limits = c(NA, 100)) + facet_wrap(~season, scales = "free_x")
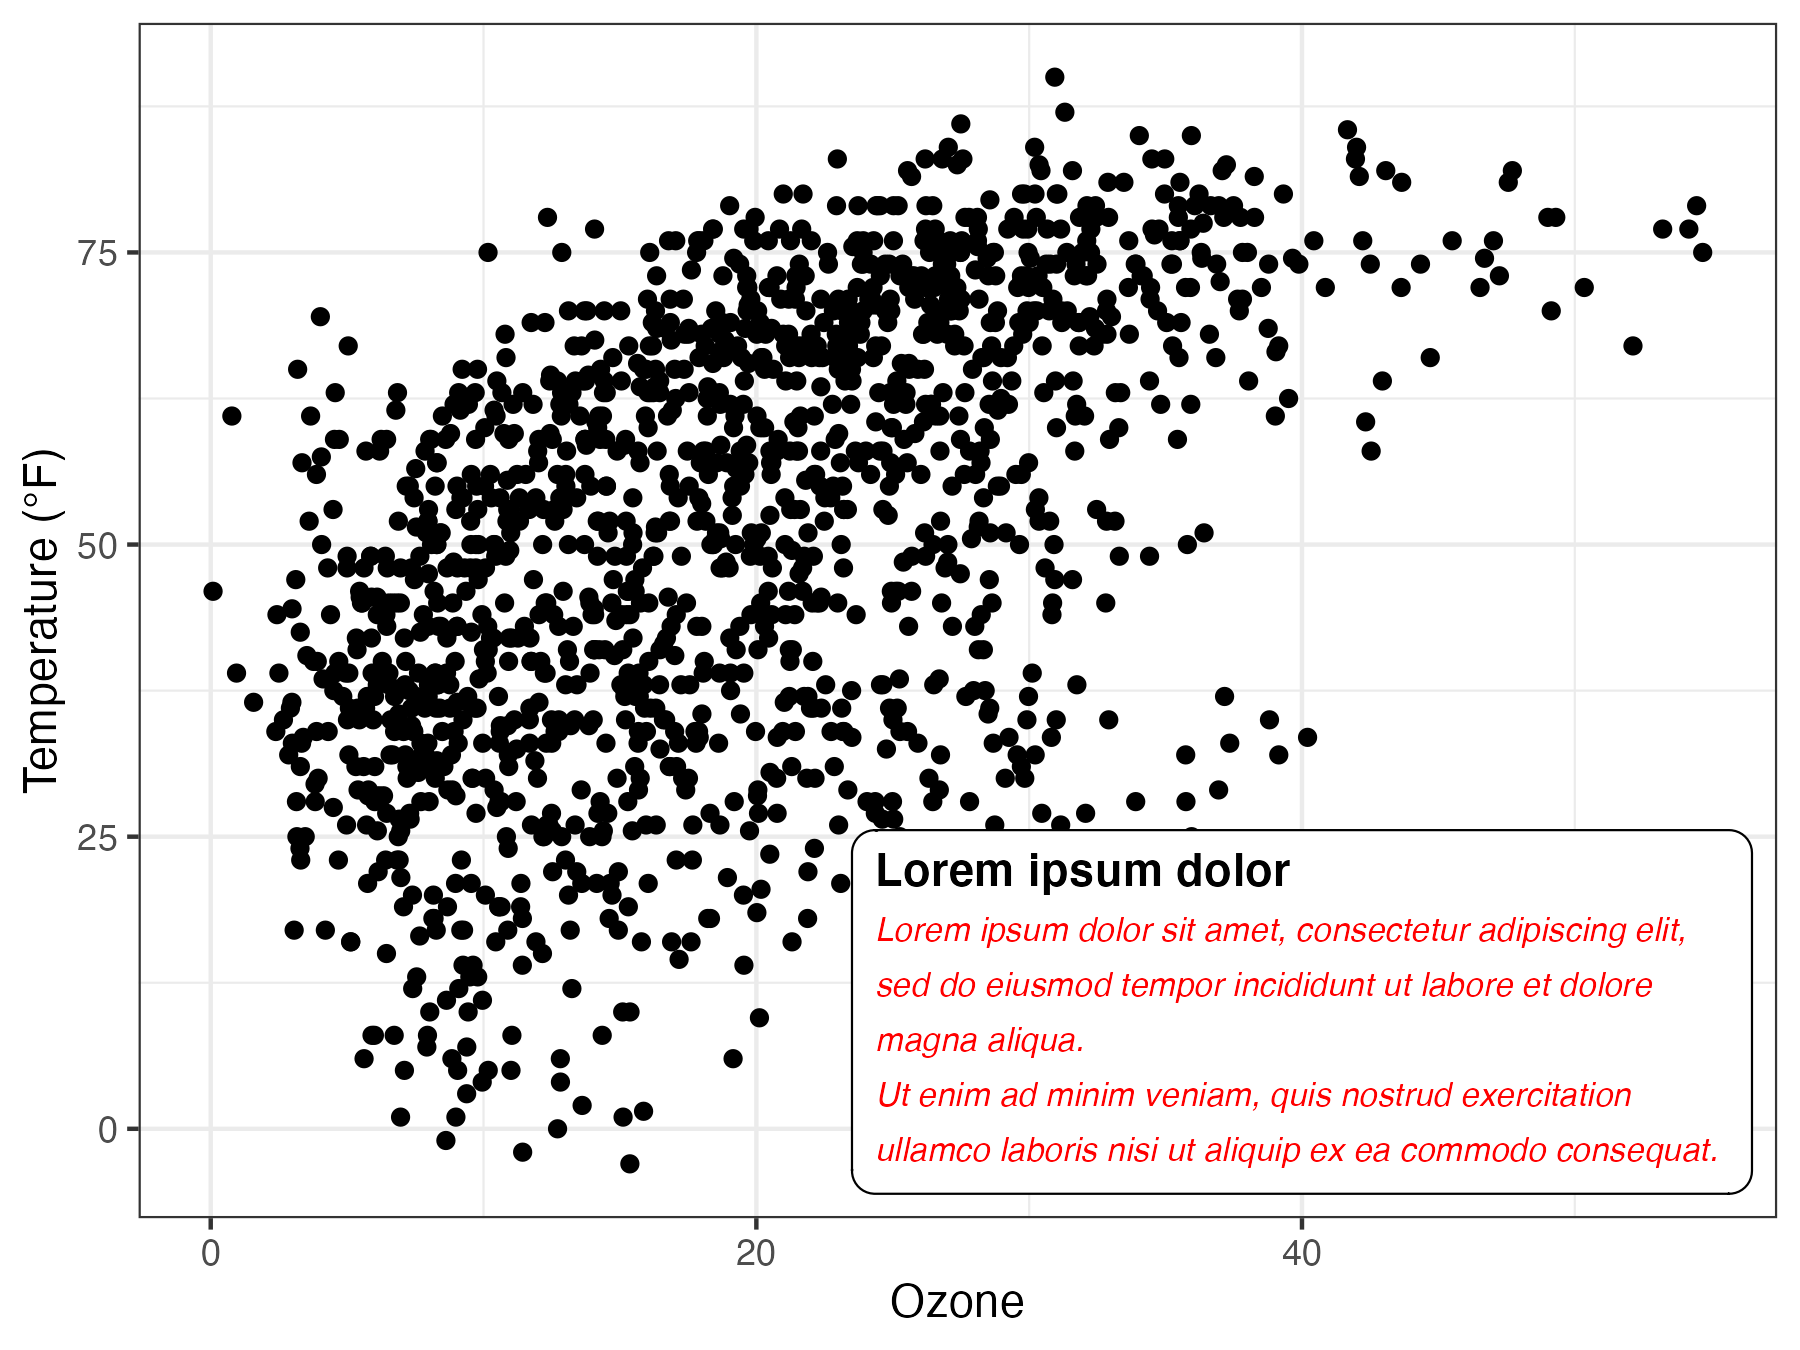
library(grid)
my_grob <- grobTree(textGrob("另一种比较炫酷的", x = .1, y = .9, hjust = 0, gp = gpar(col = "black",fontsize = 15, family = "STSong")))
g + annotation_custom(my_grob) + facet_wrap(~season, scales = "free_x") + scale_y_continuous(limits = c(NA, 100))

拓展一下Markdown和HTML
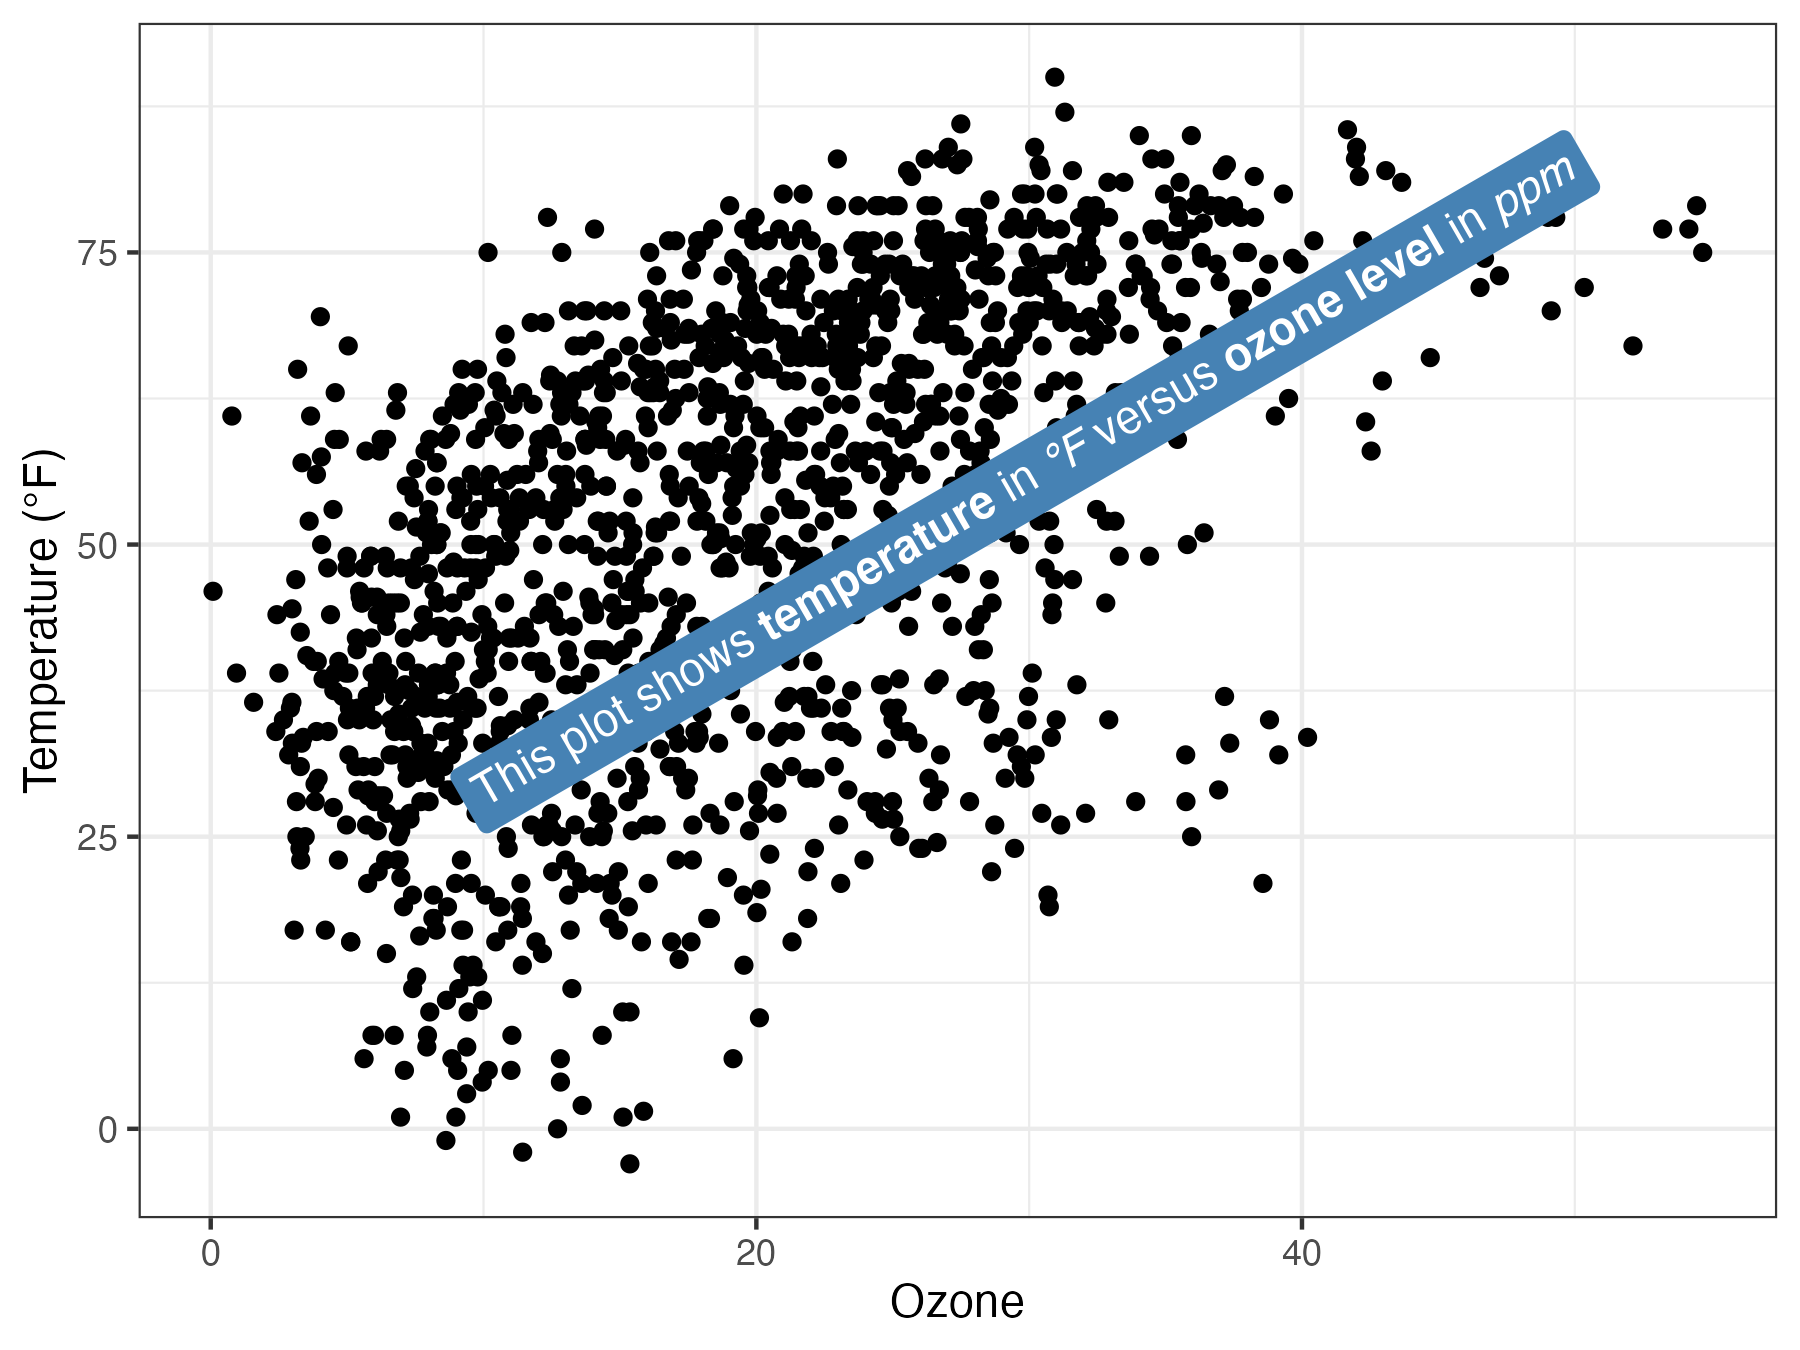
library(ggtext)
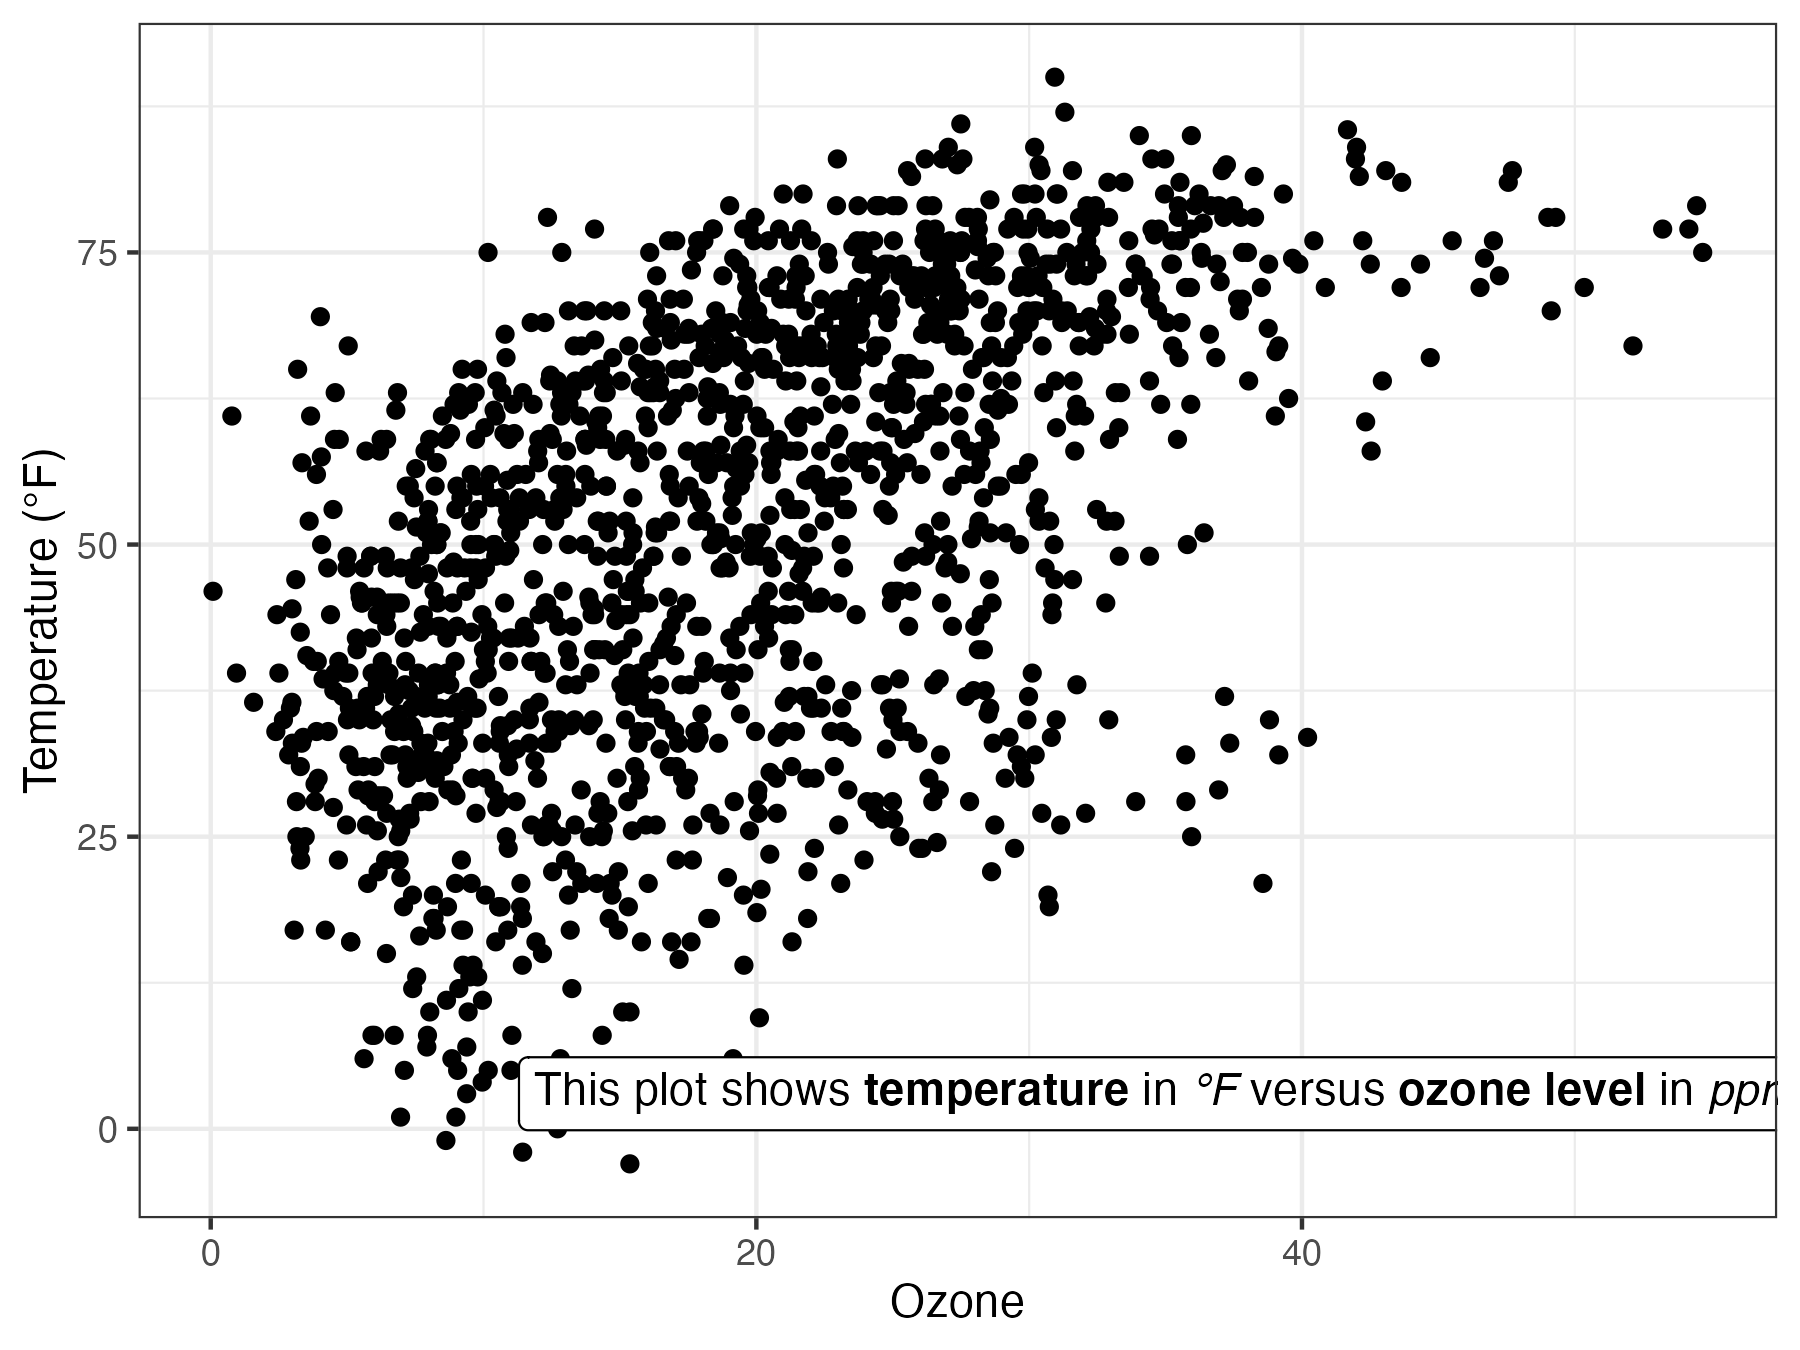
lab_md <- "This plot shows **temperature** in *°F* versus **ozone level** in *ppm*"
具体的语法自己去看吧,这是markdown的语法(或者说了解下富文本?)。
g + geom_richtext(aes(x = 35, y = 3, label = lab_md), stat = "unique")
lab_html <- "★ This plot shows <b style='color:red;'>temperature</b> in <i>°F</i> versus <b style='color:blue;'>ozone level</b>in <i>ppm</i> ★"
这是HTML语法
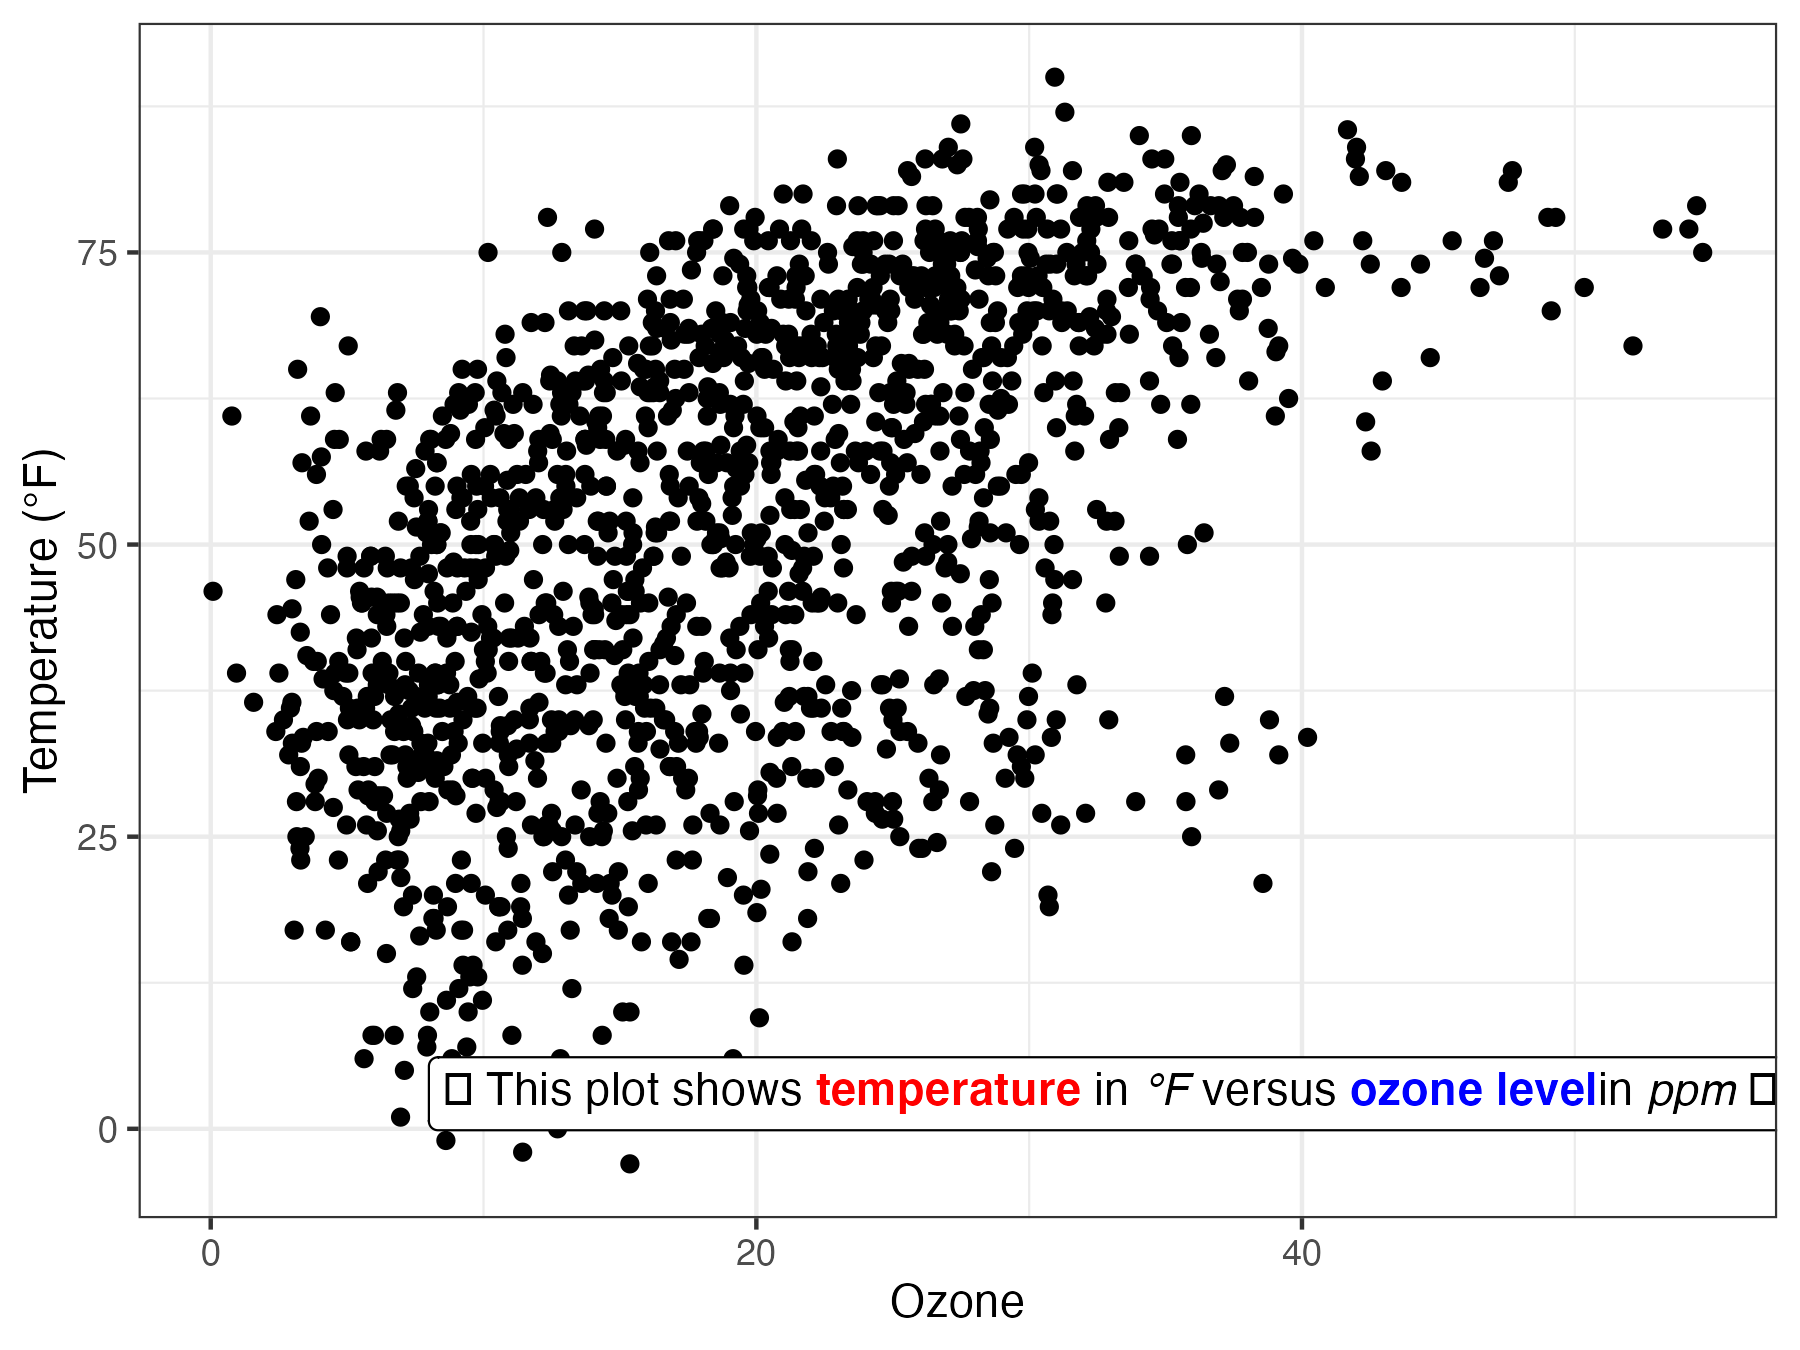
其他花哨的。