@agpwhy
2022-03-07T12:33:18.000000Z
字数 2901
阅读 377
王胖的生信笔记第40期:一些常见的科研做图
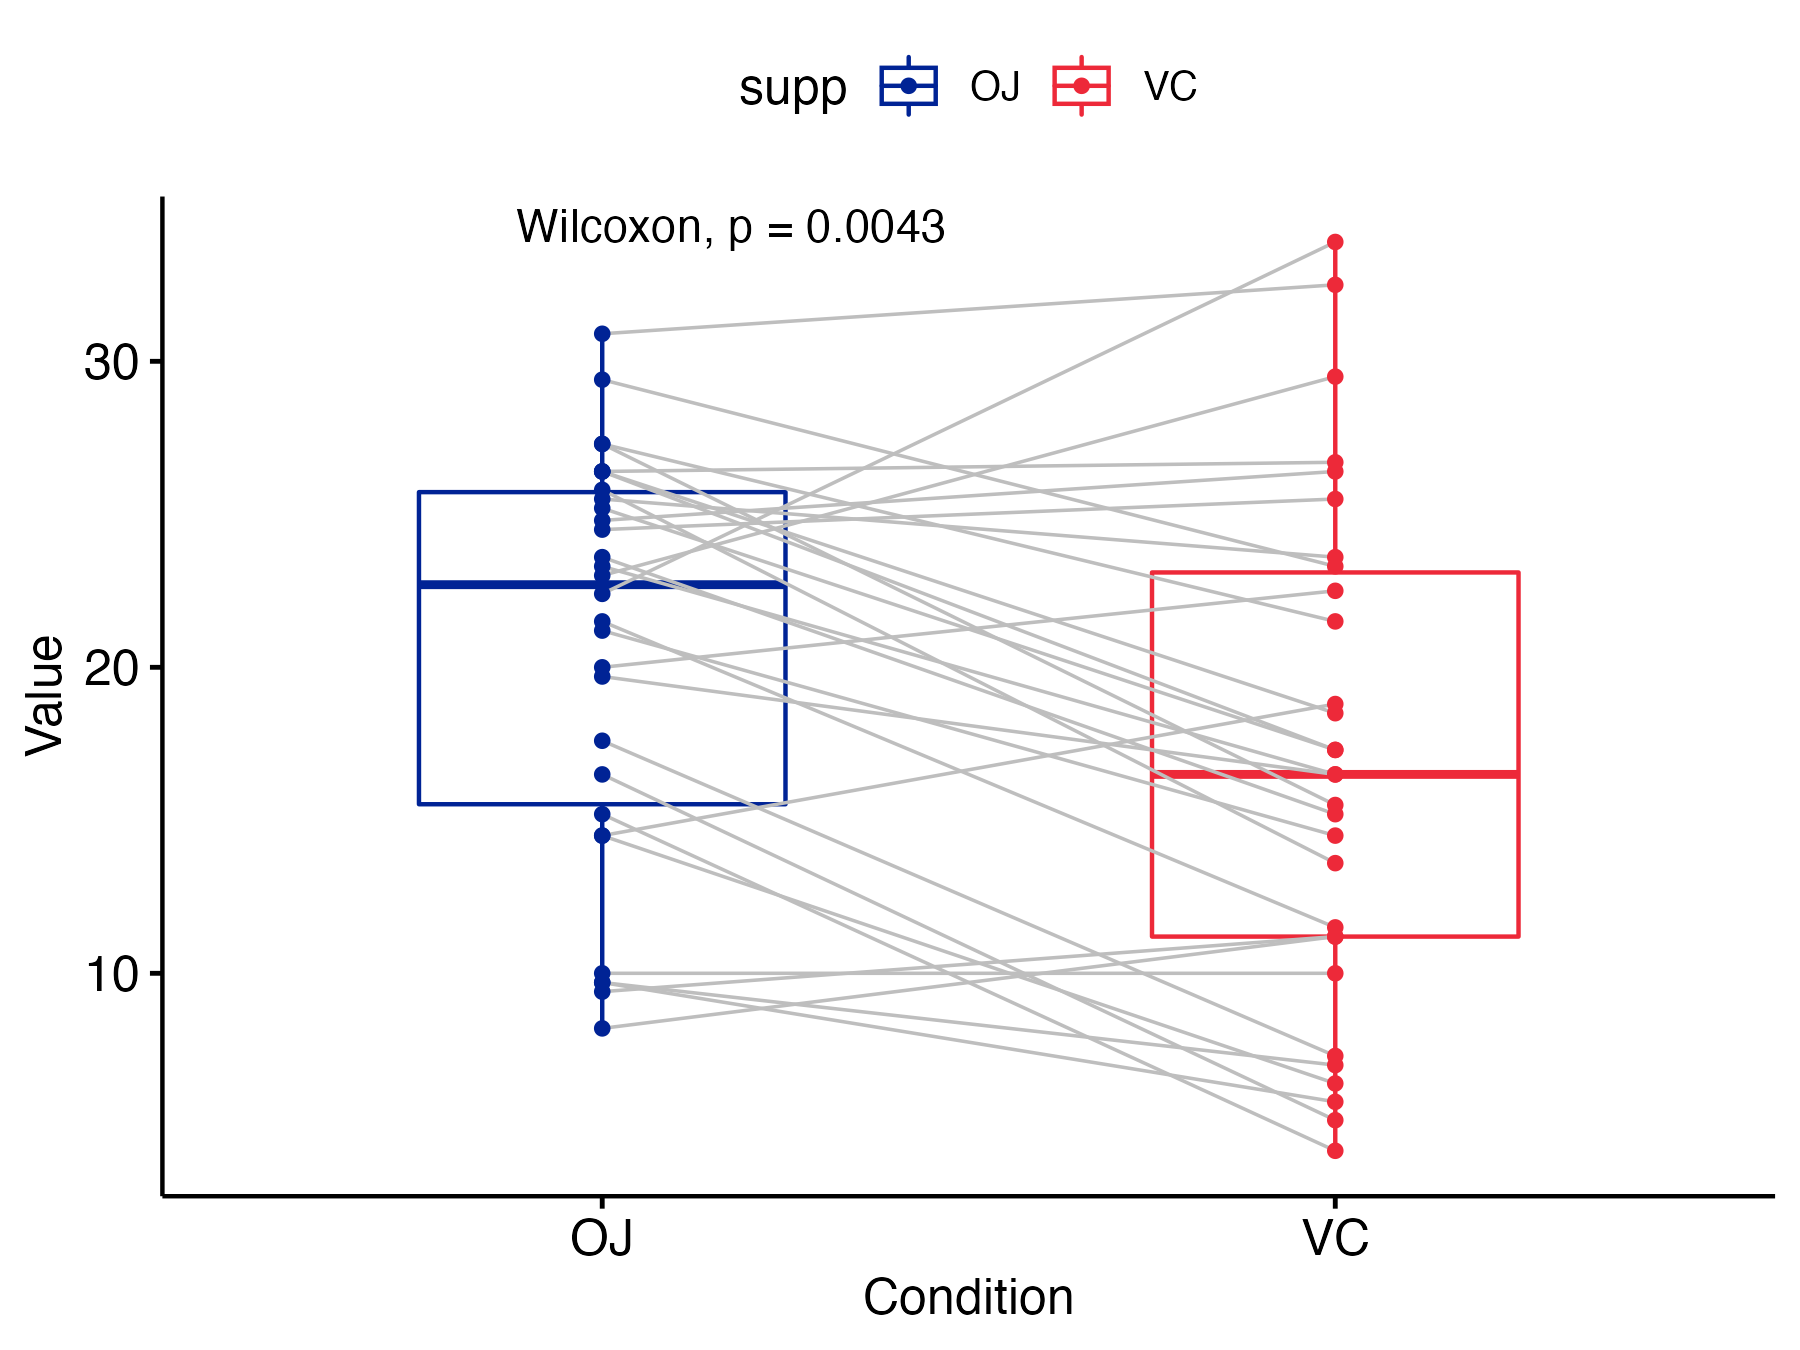
大家是不是在科研论文里经常见到这样的图:
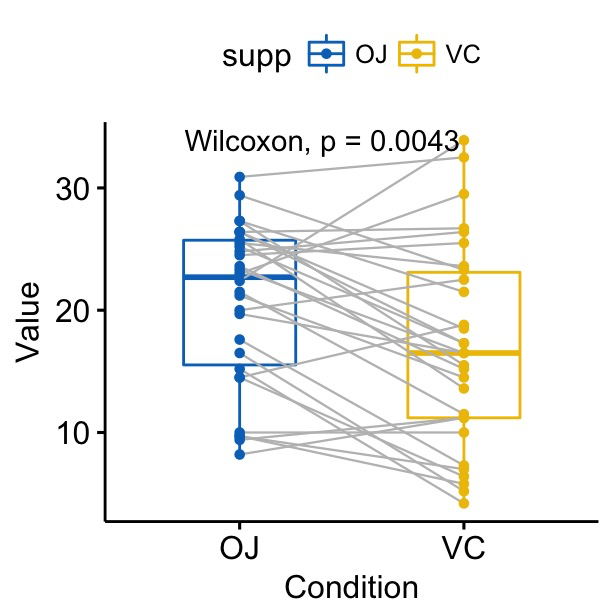
就是成对比较的两组,画出两组箱线图的同时,每个成对之间也画出线连接。
怎么画呢?这个STHDA的教程不错,和大家分享。
当然不是一定要用R去画,你擅长用GraphPad也可以。
设置环境
主要是要用到以下几个包。
library(dplyr)library(ggplot2)library(ggpubr)
用的数据集是自带的五万个钻石价格。不过为了方便展示,只用D,E,F两个颜色的数据。(原始教程用的两组,配色是介绍里提到的那样,在这时期比较敏感,我这里就用了法国国旗配色代替https://www.flagcolorcodes.com/france)。
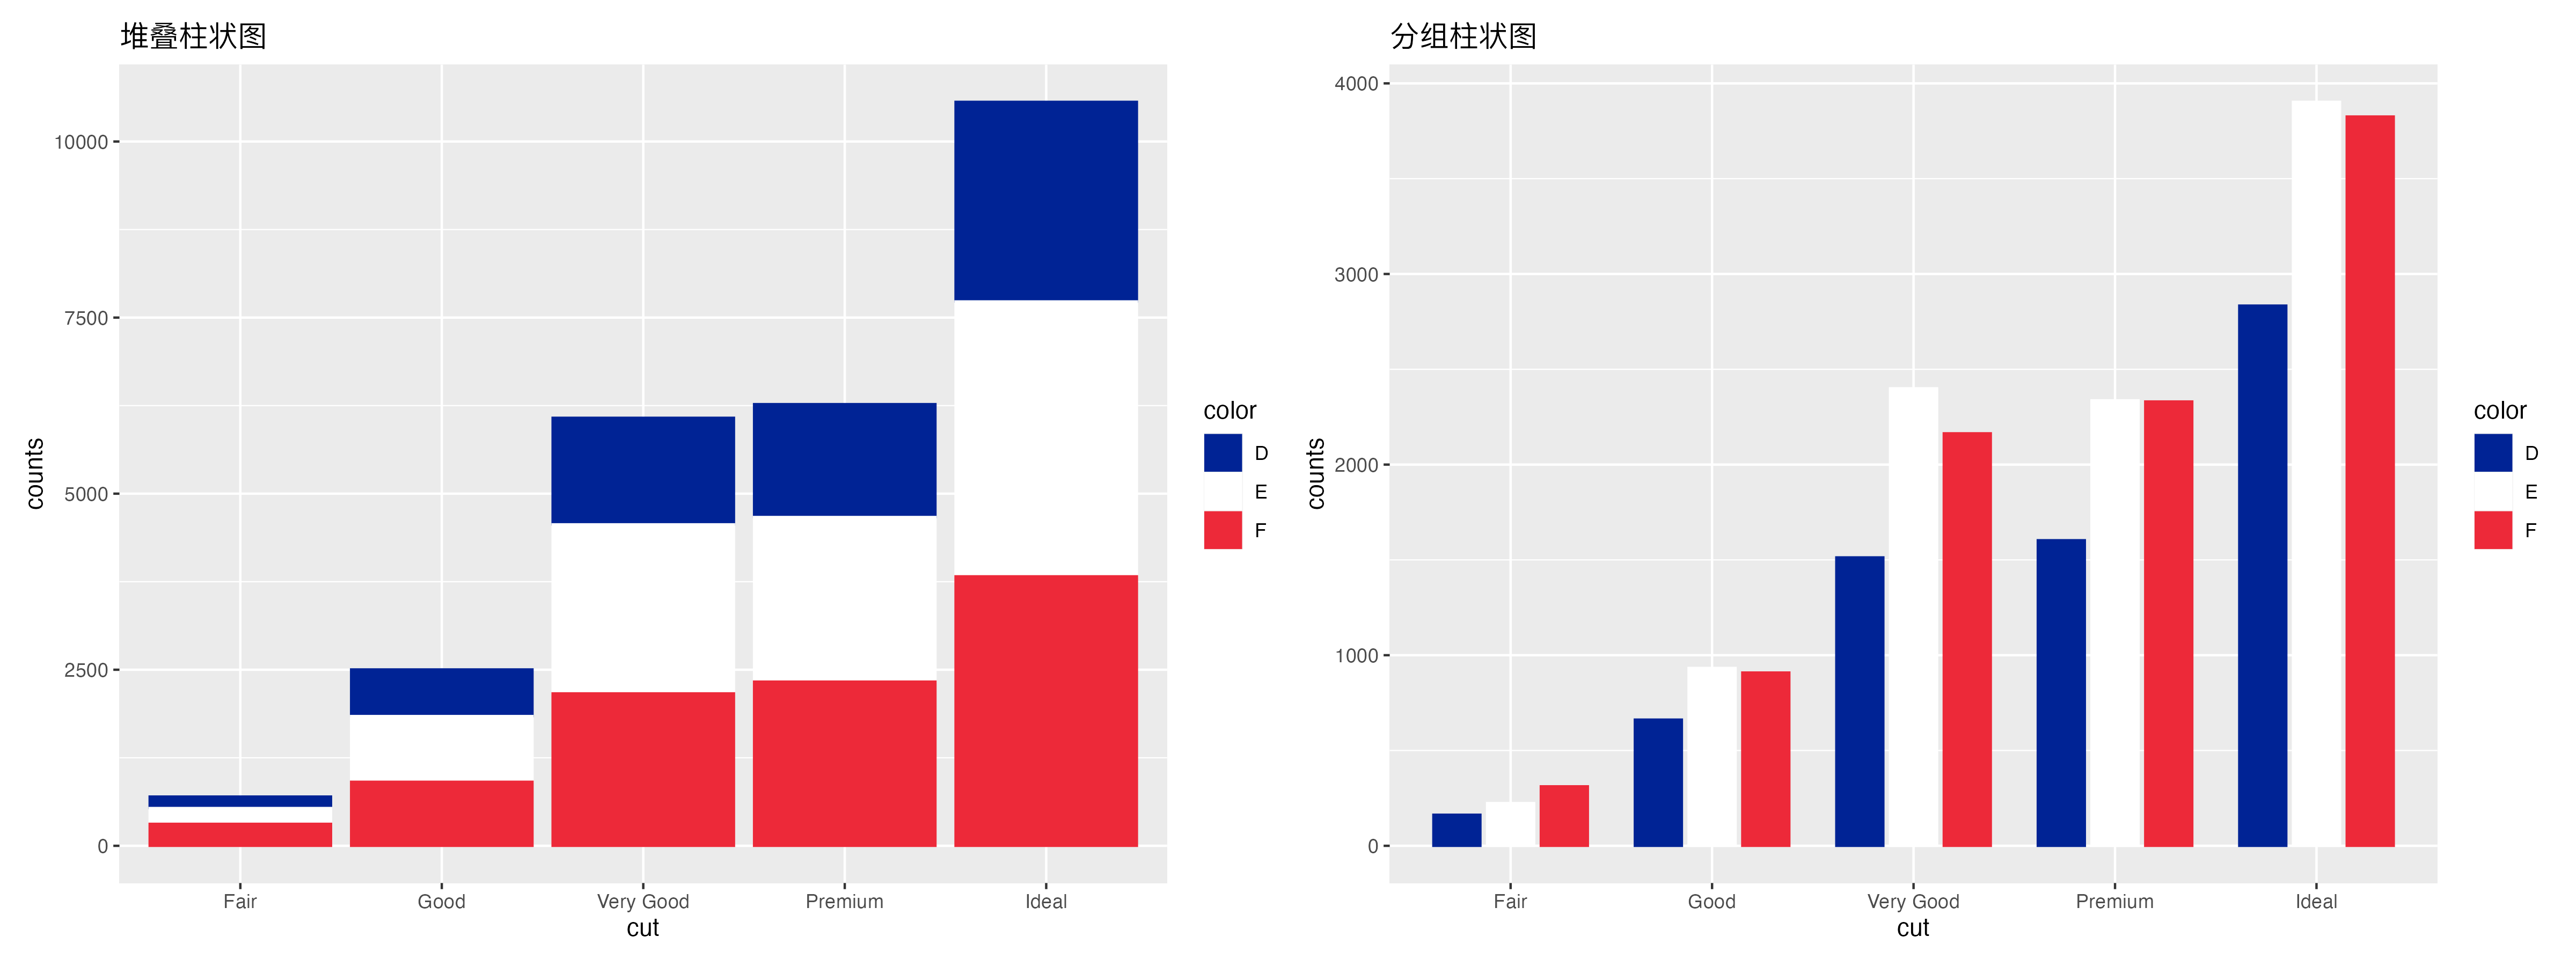
柱状图
df <- diamonds %>%filter(color %in% c("D", "E","F")) %>%group_by(cut, color) %>%summarise(counts = n())
# 堆叠柱状图ggplot(df, aes(x = cut, y = counts)) +geom_bar(aes(color = color, fill = color),stat = "identity", position = position_stack()) +scale_color_manual(values = c("#002395", "#FFFFFF","#ED2939"))+scale_fill_manual(values = c("#002395", "#FFFFFF","#ED2939"))# 分组柱状图ggplot(df, aes(x = cut, y = counts)) +geom_bar(aes(color = color, fill = color),stat = "identity", position = position_dodge(0.8),width = 0.7) +scale_color_manual(values = c("#002395", "#FFFFFF","#ED2939"))+scale_fill_manual(values = c("#002395", "#FFFFFF","#ED2939"))
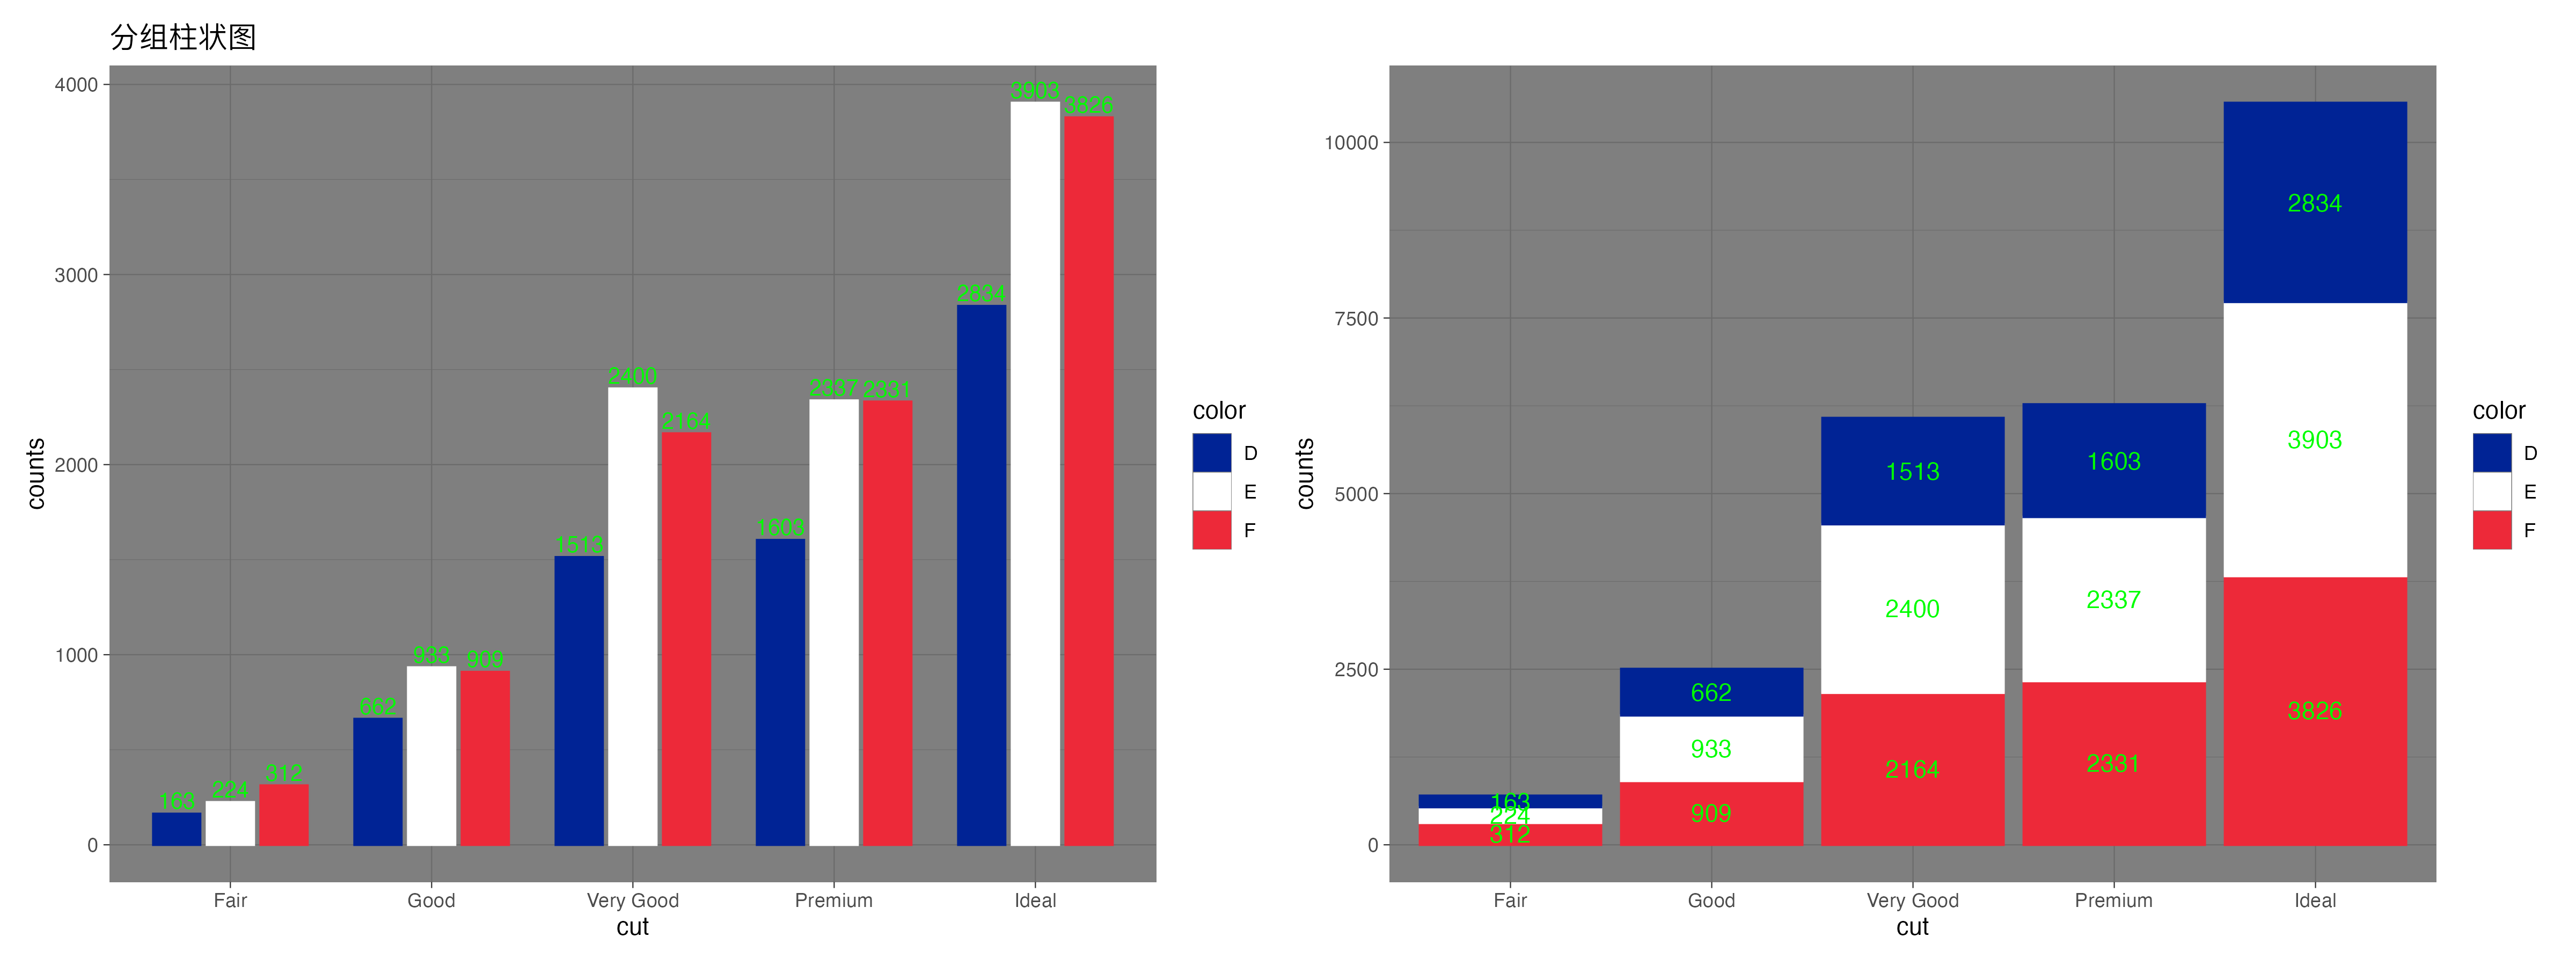
还能直接在上面标注出数字。
ggplot(df, aes(x = cut, y = counts)) +geom_bar(aes(color = color, fill = color),stat = "identity", position = position_dodge(0.8),width = 0.7) +scale_color_manual(values = c("#002395", "#FFFFFF","#ED2939"))+scale_fill_manual(values = c("#002395", "#FFFFFF","#ED2939"))+ggtitle("分组柱状图")+ geom_text(aes(label = counts, group = color),position = position_dodge(0.8),vjust = -0.3, size = 3.5) +theme_dark()
df <- df %>%arrange(cut, desc(color)) %>%mutate(lab_ypos = cumsum(counts) - .5 * counts)# 这里的.5就意味着文字在堆叠柱状图的中间ggplot(df, aes(x = cut, y = counts)) +geom_bar(aes(color = color, fill = color),stat = "identity", position = position_stack()) +scale_color_manual(values = c("#002395", "#FFFFFF","#ED2939"))+scale_fill_manual(values = c("#002395", "#FFFFFF","#ED2939"))+ggtitle("堆叠柱状图")
棒棒糖图
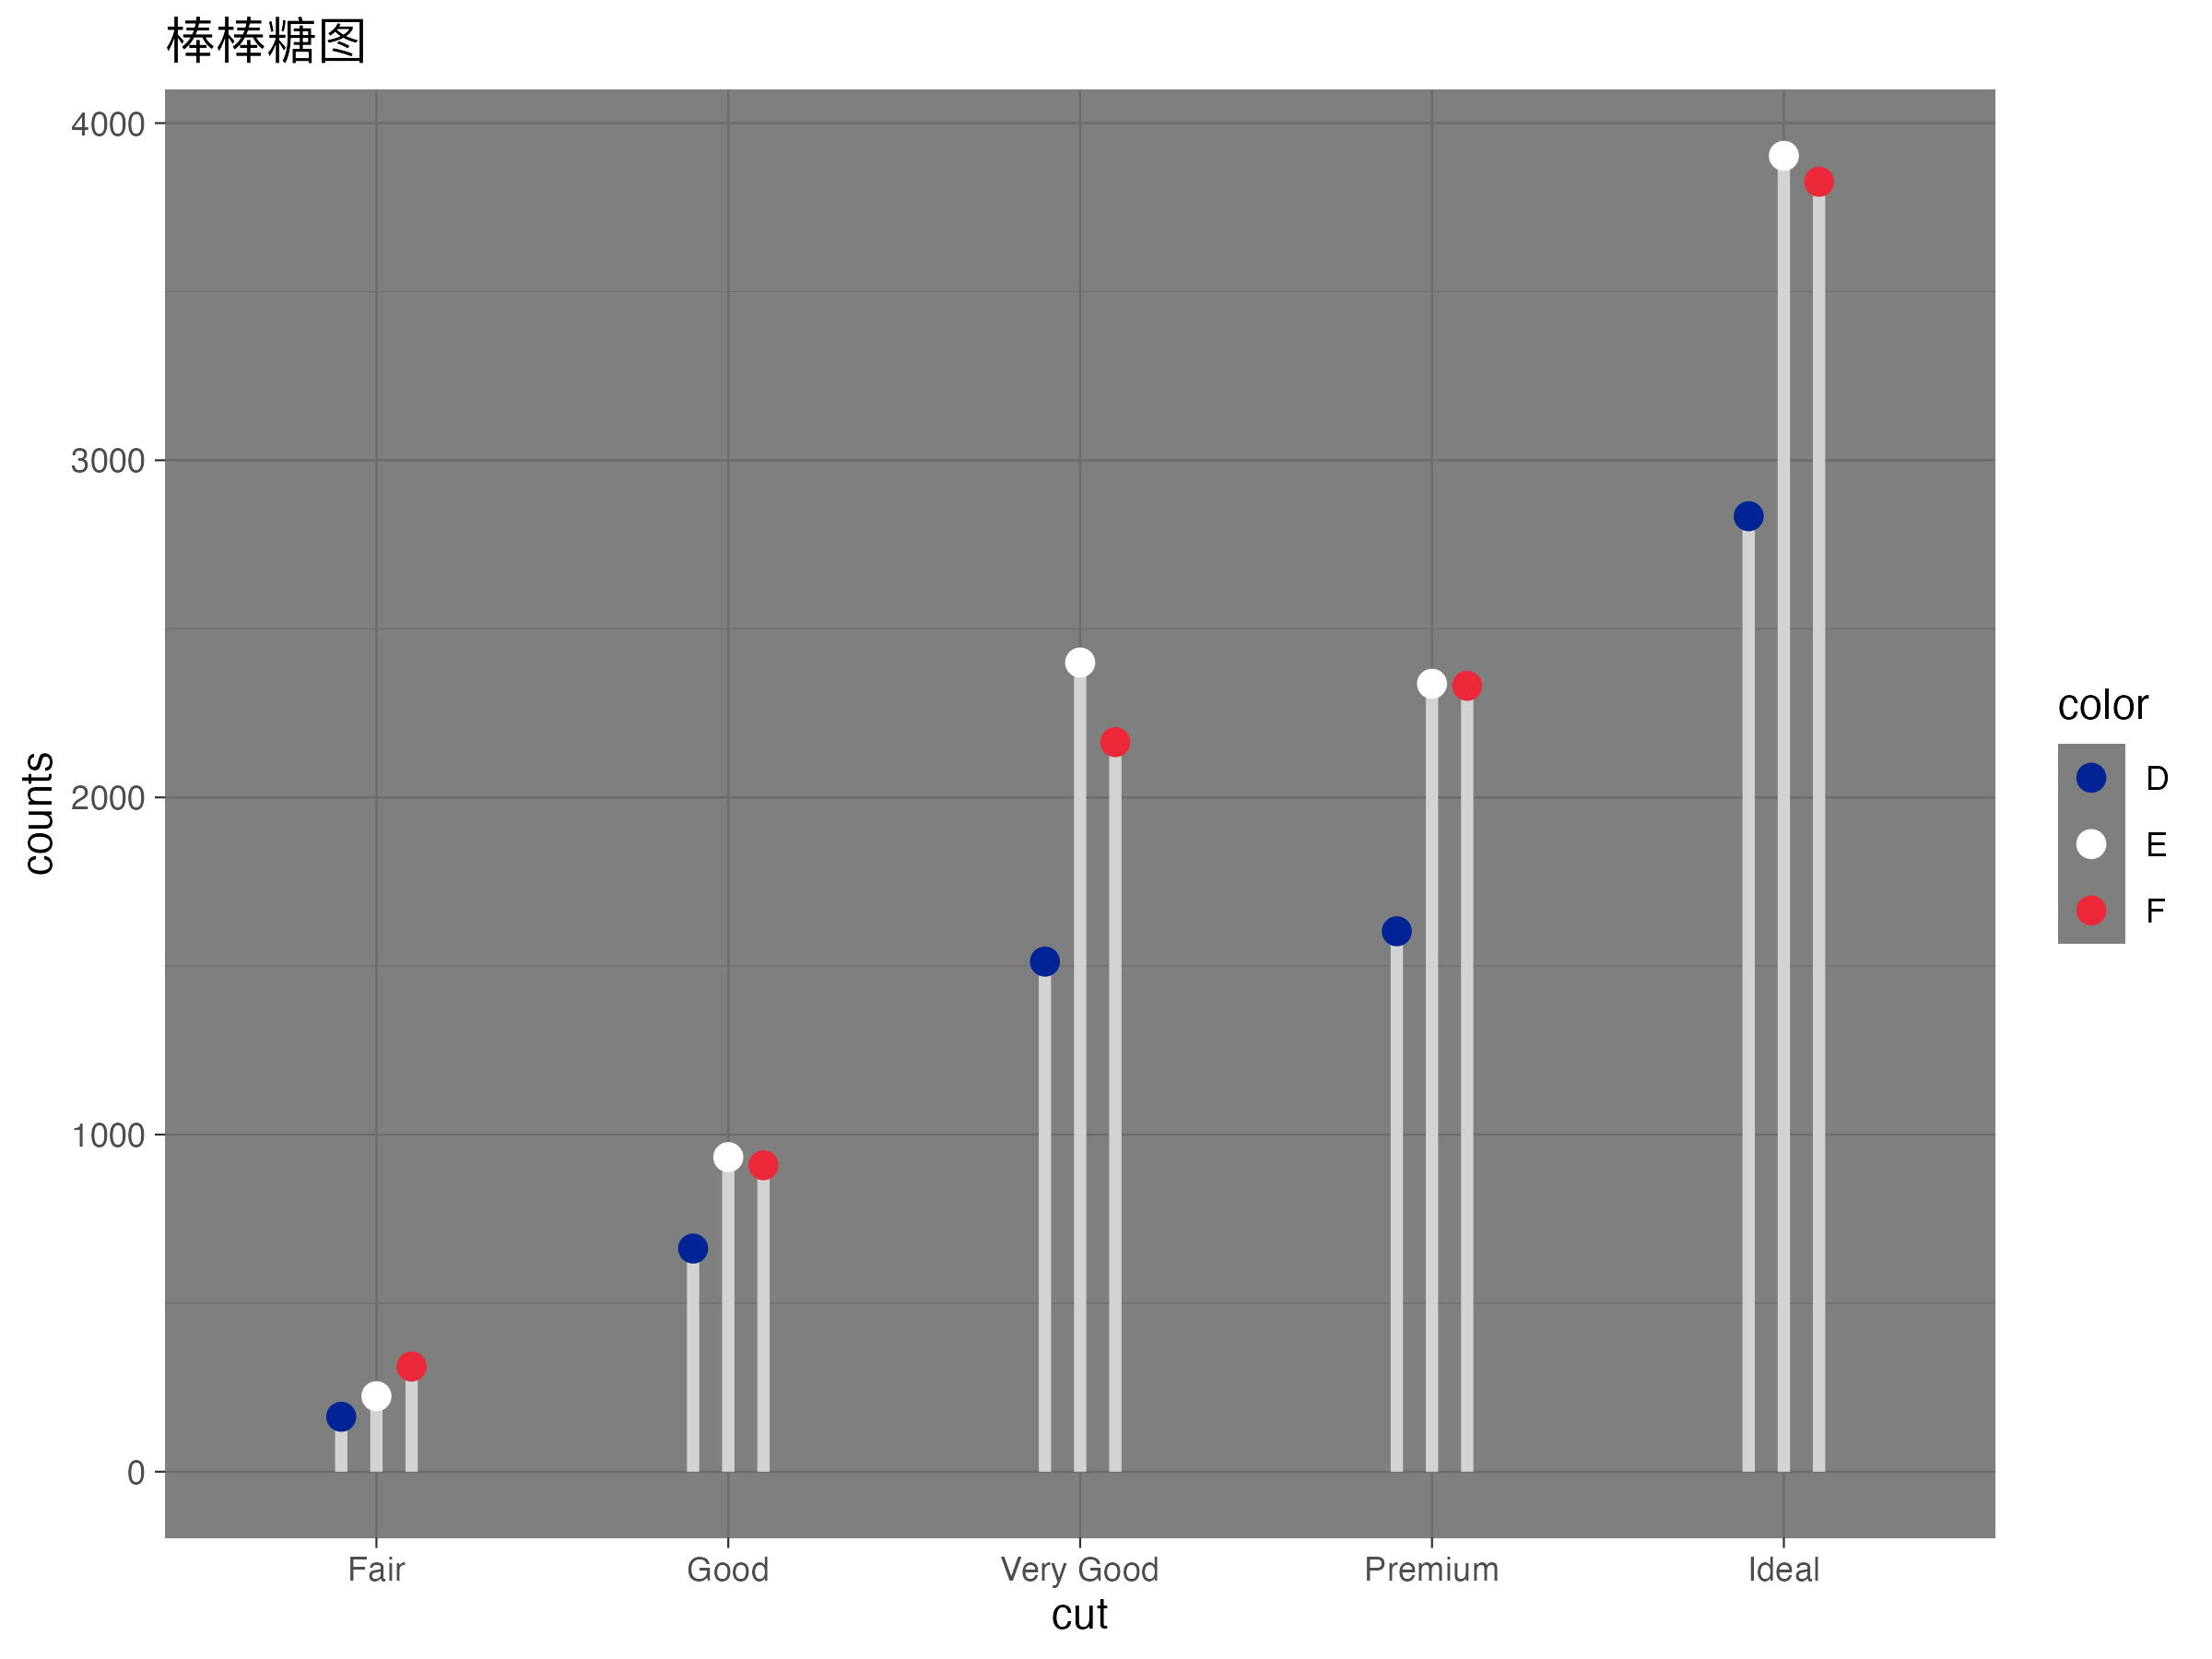
ggplot(df, aes(cut, counts)) +geom_linerange(aes(x = cut, ymin = 0, ymax = counts, group = color),color = "lightgray", size = 1.5,position = position_dodge(0.3))+geom_point(aes(color = color),position = position_dodge(0.3), size = 3)+scale_color_manual(values = c("#002395", "#FFFFFF","#ED2939"))+theme_dark()+ggtitle("棒棒糖图")
实际上使用ggdotchart肯恩更需要的参数更少一些,不过这里我就不展开啦
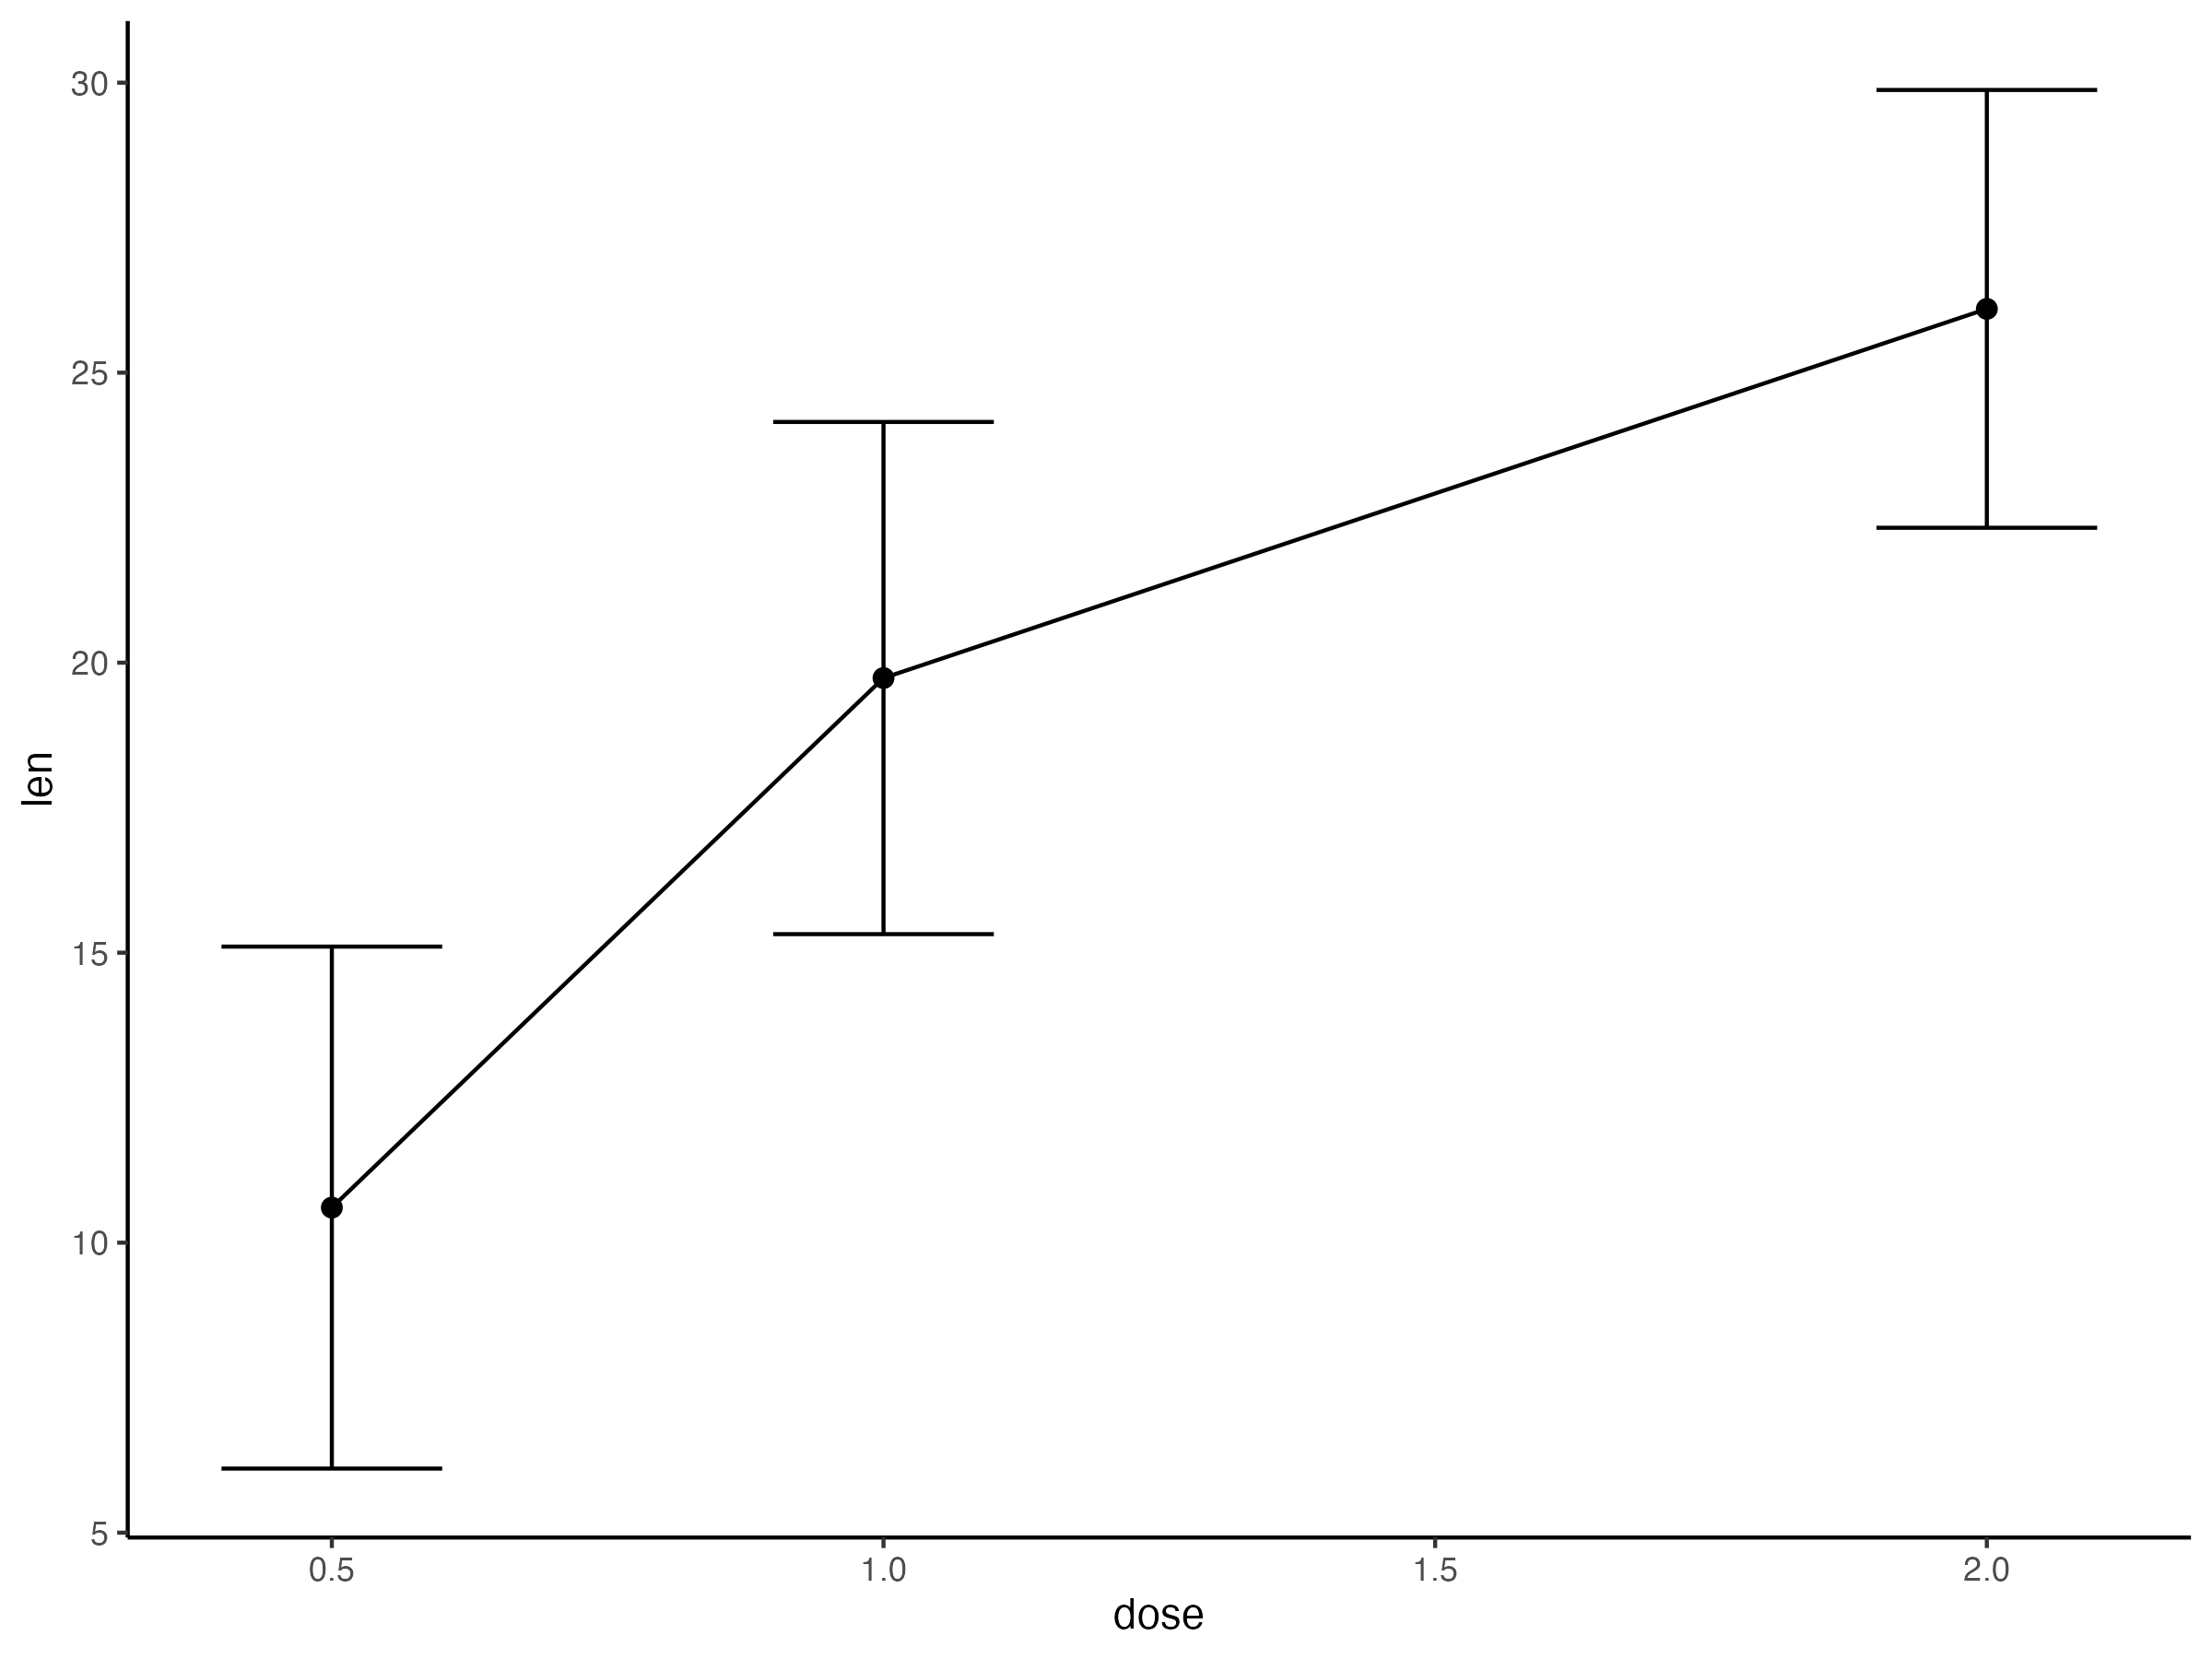
带Error Bar的折线图
换个维生素D对豚鼠牙齿生长的数据
df <- ToothGrowthdf$dose <- as.factor(df$dose)df.summary <- df %>%group_by(dose) %>%summarise(sd = sd(len, na.rm = TRUE),len = mean(len))
做带Error Bar的图。注意这里使用as.numeric的话,下面的坐标就是按照实际数值来,使用as.factor的话,下面的坐标就是按照组别来。
df.summary$dose <- as.numeric(df.summary$dose)ggplot(df.summary, aes(dose, len)) +geom_line() +geom_errorbar( aes(ymin = len-sd, ymax = len+sd),width = 0.2) +geom_point(size = 2)+theme_classic()
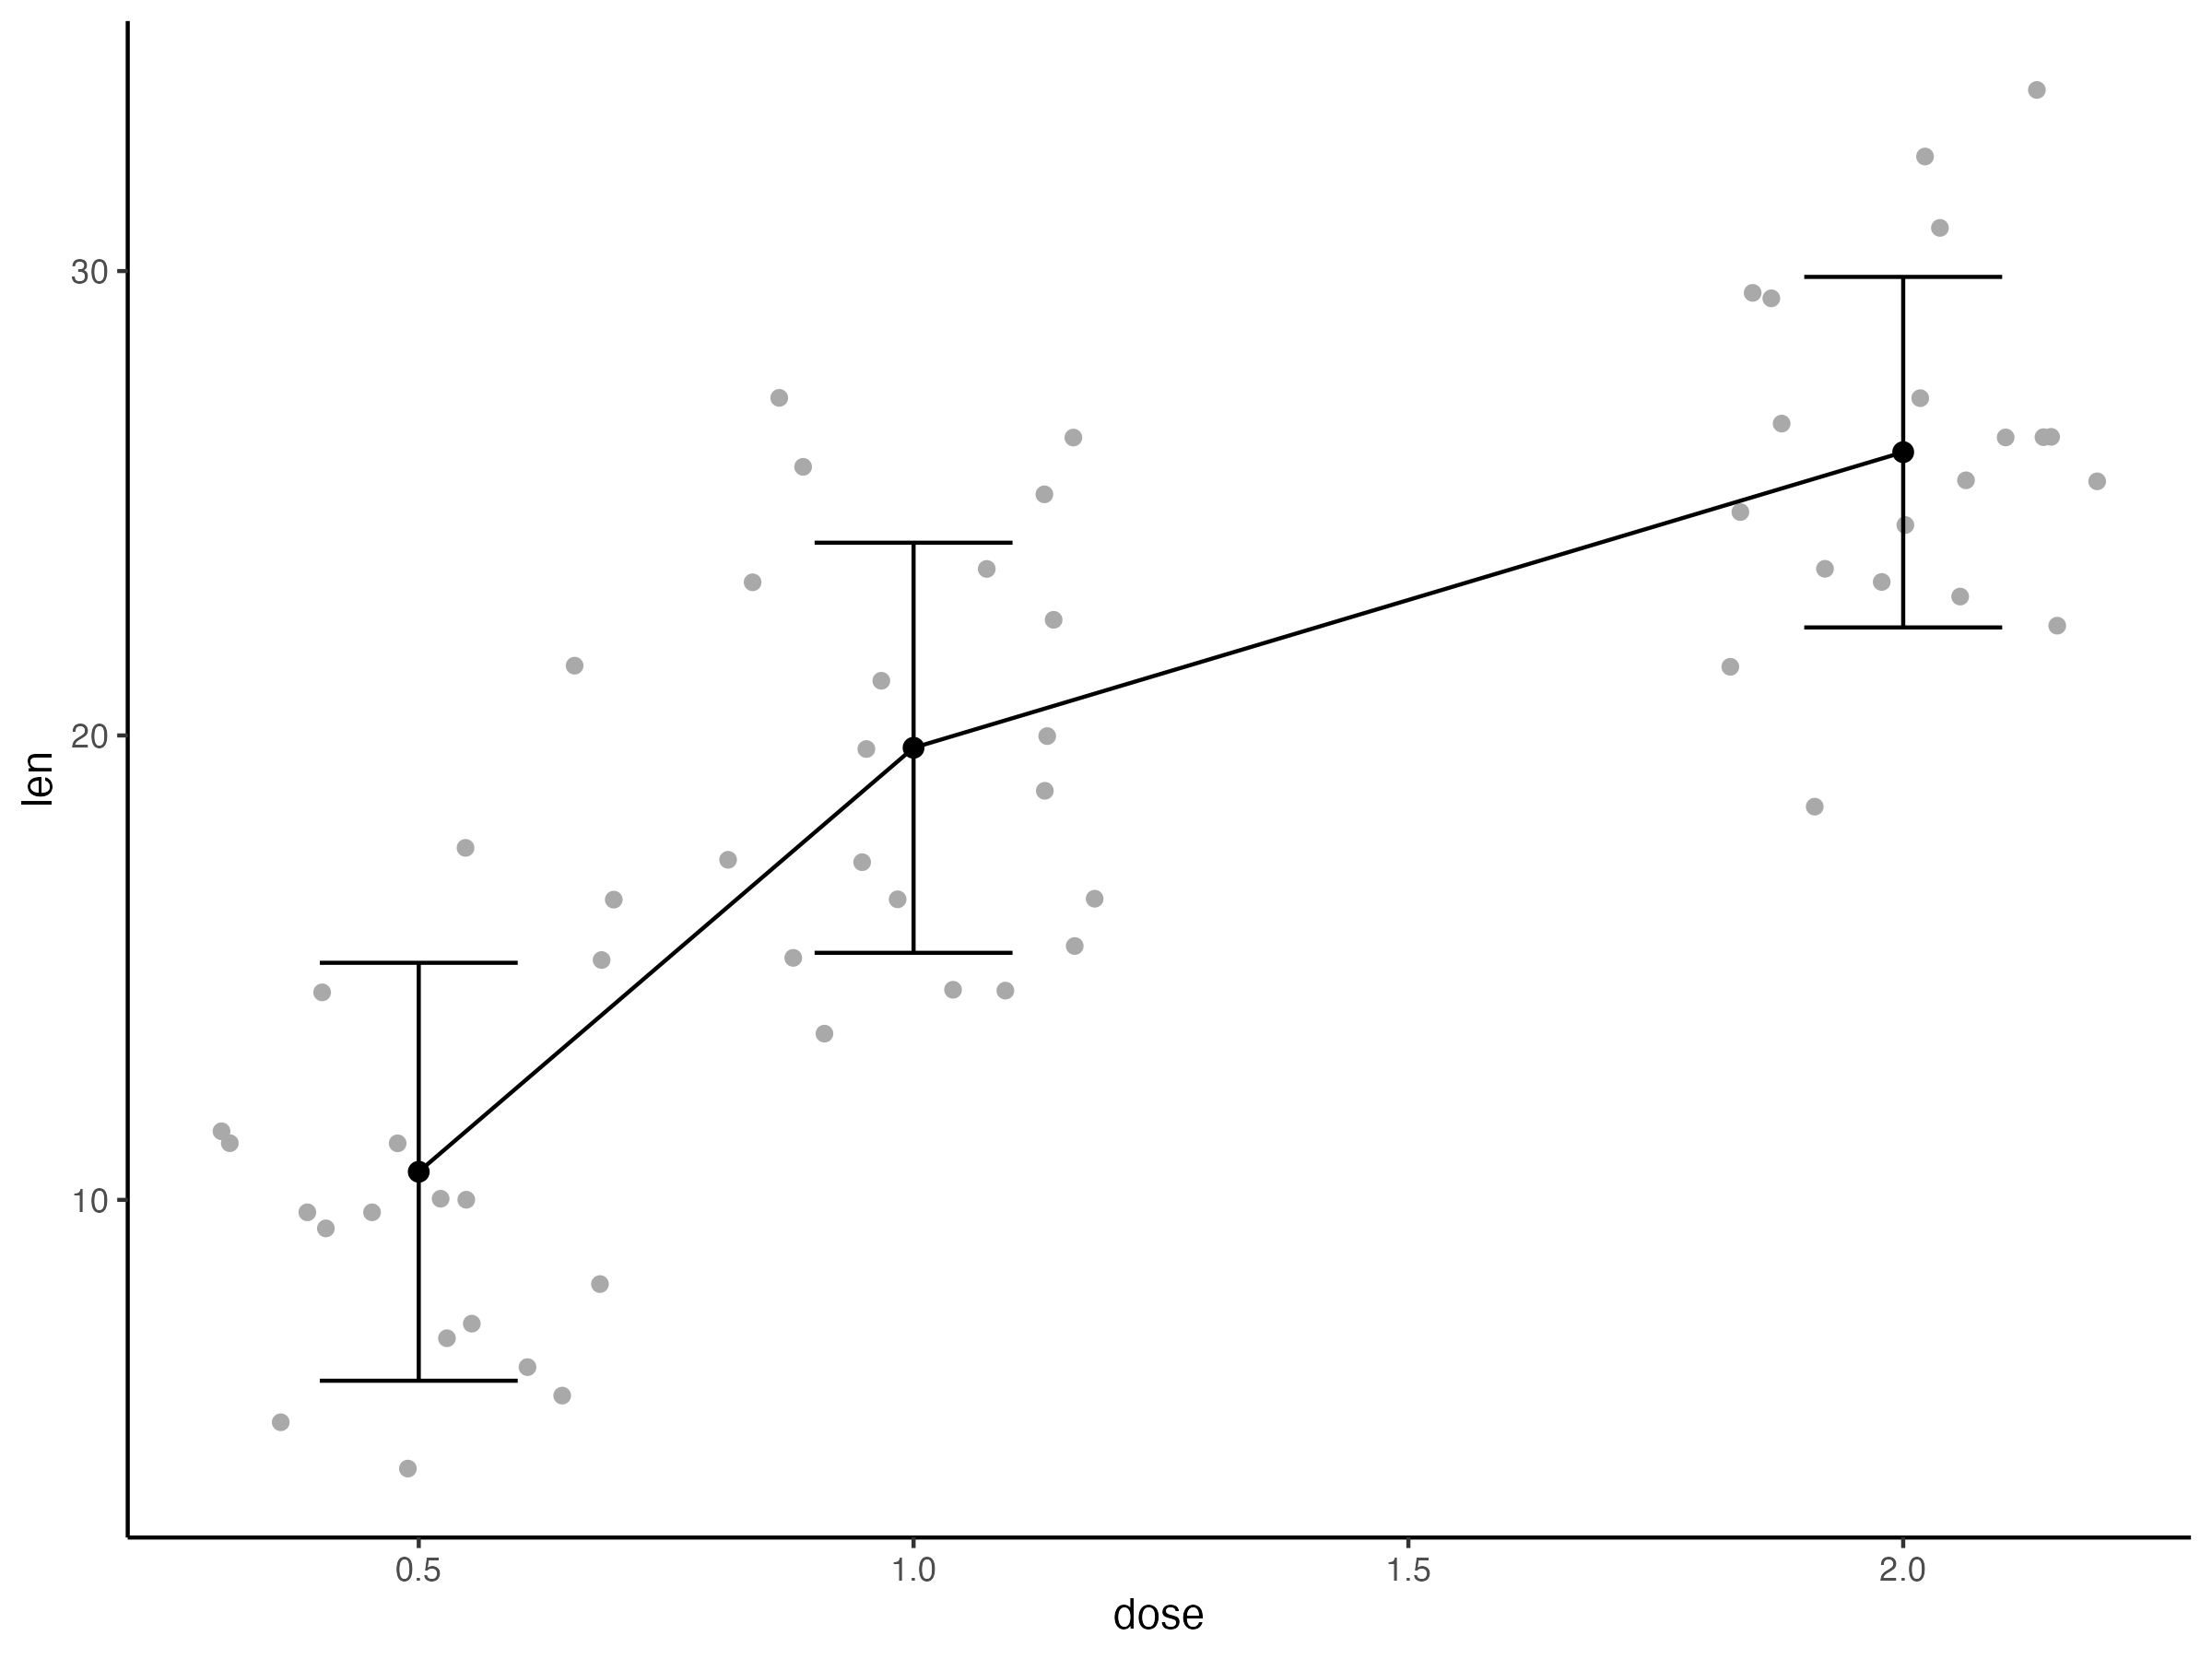
可以再加上每组的数据散点
df$dose <- as.numeric(df$dose)ggplot(df, aes(dose, len)) +geom_jitter( position = position_jitter(0.2),color = "darkgray") +geom_line(aes(group = 1), data = df.summary) +geom_errorbar(aes(ymin = len-sd, ymax = len+sd),data = df.summary, width = 0.2) +geom_point(data = df.summary, size = 2)+theme_classic()
做介绍里的成对比较图
ggpaired(ToothGrowth, x = "supp", y = "len",color = "supp", line.color = "gray", line.size = 0.4,palette = c("#002395","#ED2939"))+stat_compare_means(paired = TRUE)